One page showing the health and temperature of every disk in the house
See the health and temperature of every disk on one page, spot disks that are slowly failing, and get phone alerts.
Before you start
- A machine that is always on to host the dashboard. A small Proxmox node or any Docker host is enough.
- Docker on each machine whose disks you want to watch. The examples use TrueNAS SCALE. A normal Linux host works the same way.
- An ntfy topic for the alerts, or any other service Scrutiny supports.
- Fill in Your values below and every command and path on this page updates to match.
Your values
Fill these in and every command below updates to match. Nothing is sent anywhere.
Run this at your own risk. These steps worked on my hardware; yours may differ. Take a backup first, read each command before running it, and see the disclaimer.
Every disk already knows how healthy it is. Since the day it was made, SMART has counted reallocated sectors, pending sectors and power-on hours. The problem is that nobody looks. And when you finally look, you only see one number for today, with nothing to compare it to.
Disks rarely fail suddenly. They get worse slowly. Three reallocated sectors mean little on their own. But if there was only one last month, that is a warning. You only see this if something records the numbers over time.
This guide builds one page with every drive in the house: health, temperature, and the history of both. When a drive's score drops, you get an alert on your phone.
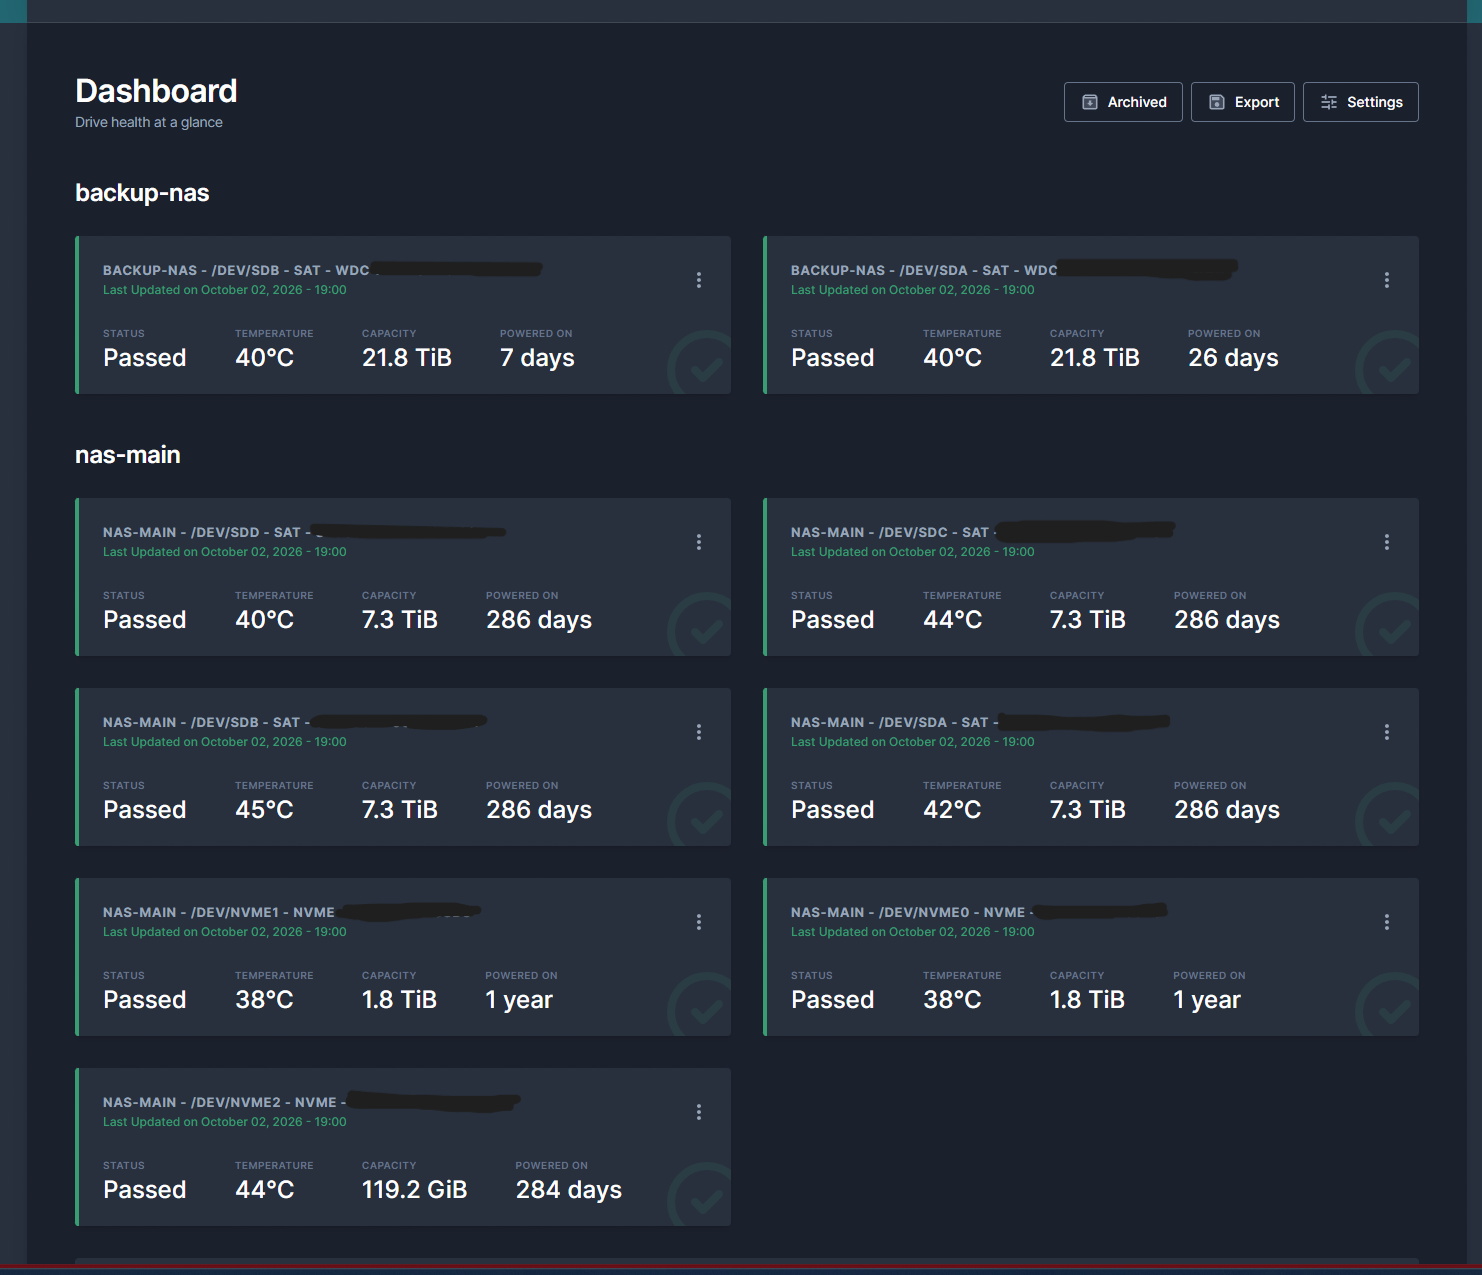
The shape: one hub, one collector per machine
| Piece | Where it runs | Job |
|---|---|---|
| Hub (web + InfluxDB) | A machine that is always on | Stores history, draws the page, sends alerts |
| Collector | On each machine with disks | Reads SMART on that machine and sends it to the hub |
This split is important. The collector must read the physical disks, so it runs on the machine that has them. The history must stay available when a machine is off, so the hub runs on a machine that is always on.
My hub runs on a small second Proxmox node for this reason. One of my two NAS machines is off most of the day. A dashboard that only works while the watched machine is on would be useless.
Part 1: The hub
Step 1: Create the container
On the always-on Proxmox node:
pveam update
TPL=$(pveam available --section system | awk '/debian-13-standard.*_amd64/ {print $2}' | sort -V | tail -1)
pveam download local "$TPL"
Check that the name ends in
_amd64.tar.zst. Proxmox also lists ARM templates. With those, the container is created without errors, but then it will not start and shows "Exec format error".
TPL=$(ls /var/lib/vz/template/cache/ | grep 'debian-13-standard.*_amd64' | sort -V | tail -1)

pct create 135 local:vztmpl/$TPL \
  --hostname scrutiny \
  --cores 2 --memory 1024 --swap 512 \
  --rootfs local-lvm:10 \
  --net0 name=eth0,bridge=vmbr0,ip=192.168.1.35/24,gw=192.168.1.1 \
  --nameserver 192.168.1.1 \
  --unprivileged 1 --features nesting=1,keyctl=1 \
  --onboot 1

pct start 135
pct exec 135 -- bash -c "apt update && apt full-upgrade -y && apt install -y curl ca-certificates && curl -fsSL https://get.docker.com | sh"
The 10 GB disk is for the InfluxDB history. It grows slowly: a year of hourly data from a dozen drives is small.
Step 2: Configure and start it
pct enter 135Check that the prompt says root@scrutiny, then:
mkdir -p /opt/scrutiny/config /opt/scrutiny/influxdb
cat > /opt/scrutiny/config/scrutiny.yaml <<'EOF'
version: 1
web:
  listen:
    port: 8080
    host: 0.0.0.0
  influxdb:
    host: influxdb
    port: 8086
    retention_policy: true
notify:
  urls:
    - "ntfy://ntfy.sh/myhome-alerts-3f9a1c2b7e4d"
EOF
That notify block is the whole alert setup. Scrutiny can send to many services with the same one-line format, for example Discord, Telegram, e-mail or Gotify. ntfy needs no account.
cat > /opt/scrutiny/compose.yaml <<'EOF'
services:
  influxdb:
    image: influxdb:2.7
    container_name: scrutiny-influxdb
    restart: unless-stopped
    volumes:
      - ./influxdb:/var/lib/influxdb2
  web:
    image: ghcr.io/analogj/scrutiny:master-web
    container_name: scrutiny-web
    restart: unless-stopped
    ports:
      - "8080:8080"
    volumes:
      - ./config:/opt/scrutiny/config
    environment:
      - TZ=Europe/Berlin
    depends_on:
      - influxdb
EOF
cd /opt/scrutiny && docker compose up -d
Test the phone alert now, not on the day a disk is failing:
curl -s -X POST http://localhost:8080/api/health/notifyA test notification should arrive within seconds. Type exit to leave the container.
The dashboard is at http://192.168.1.35:8080. It is still empty, because no collector has reported yet.
Part 2: A collector on each machine
Repeat this for every machine that has disks. The examples use TrueNAS. On a normal Linux host it is the same container with the same two mounts.
Step 3: Somewhere for the config to live
Create a dataset with the Apps preset:
| Machine | Dataset |
|---|---|
| First NAS | /mnt/pool1/apps/scrutiny-collector |
| Second NAS | /mnt/pool2/system/scrutiny-collector |
Step 4: The collector config
Run this in the NAS shell. The id is the name of this machine on the dashboard, so give each machine a different one:
mkdir -p /mnt/pool1/apps/scrutiny-collector/config
cat > /mnt/pool1/apps/scrutiny-collector/config/collector.yaml <<'EOF'
version: 1
host:
  id: "nas-1"
api:
  endpoint: "http://192.168.1.35:8080"
log:
  file: "/opt/scrutiny/config/collector.log"
  level: INFO
EOF
Step 5: Install the collector app
TrueNAS: Apps → Discover Apps → Install via YAML, name it scrutiny-collector:
services:
  scrutiny-collector:
    image: ghcr.io/analogj/scrutiny:master-collector
    restart: unless-stopped
    privileged: true
    volumes:
      - /run/udev:/run/udev:ro
      - /mnt/pool1/apps/scrutiny-collector/config:/opt/scrutiny/config
    environment:
      COLLECTOR_CRON_SCHEDULE: "0 * * * *"
      TZ: "Europe/Berlin"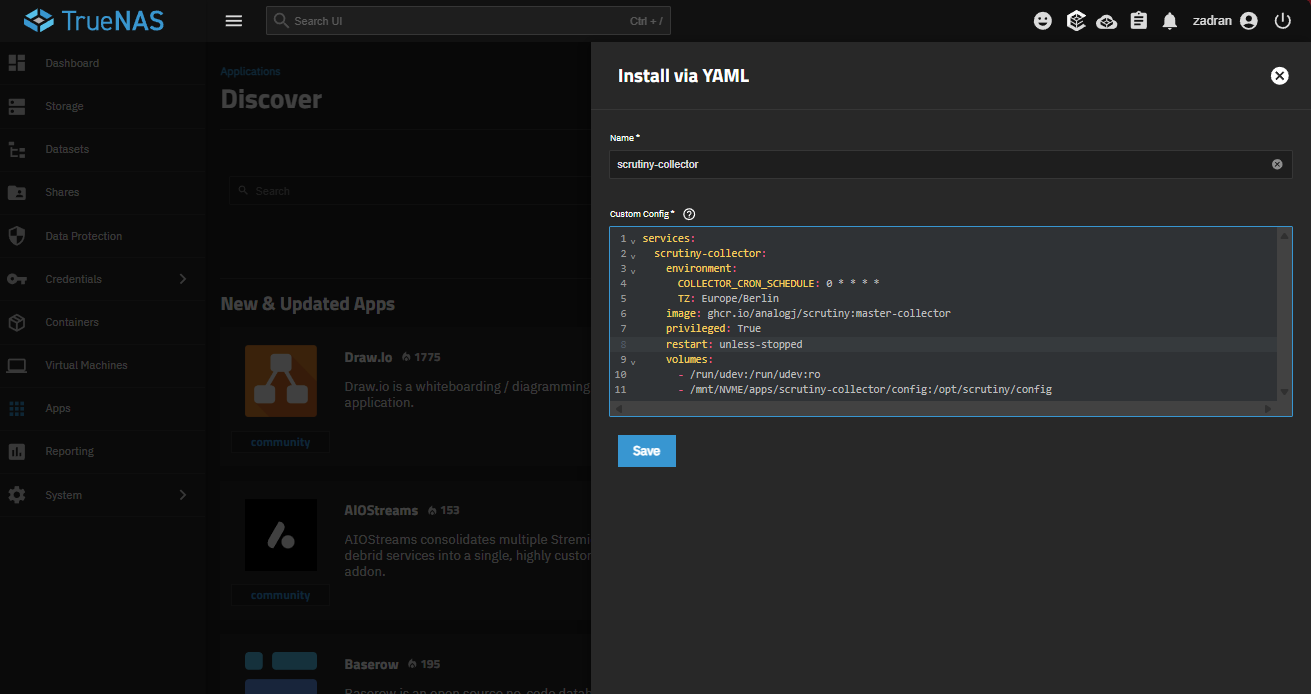
Two lines there are required, even if they look like something you should remove for security:
privileged: true— to read SMART, the collector must access the disk devices directly. Without it the collector starts, finds nothing, and reports no drives./run/udev:/run/udev:ro— this tells the container what the disks really are. Without it you may get values without model, serial number or size.
Set the schedule for the hours when the machine is on. Every hour is right for a NAS that runs all the time. For a machine that only runs at night, use a shorter interval, for example */30 * * * *, so it collects a few samples while it is on. A machine that runs only at night with an hourly schedule records almost nothing.
Step 6: Don't wait an hour
Because of the cron schedule, the first report can take up to an hour. Start one now:
docker exec $(docker ps -q --filter name=scrutiny-collector) scrutiny-collector-metrics runReload the dashboard, and the drives appear.
Step 7: Repeat on the second machine
Do the same three steps, with its own path and its own name: /mnt/pool2/system and id: "nas-2". Both machines report to the same hub, and the dashboard shows every drive in the house on one page.
Part 3: Make the alerts mean something
Settings → Device Status – Thresholds → Both.
Scrutiny can check a drive in two ways, and "Both" uses them together:
| SMART | The drive's own result. Honest, but often too late: many drives report PASSED until the moment they stop. |
| Scrutiny | Its own scoring, based on research about which SMART values really predict a failure. Warns earlier. |
SMART alone warns too late, and Scrutiny alone sometimes warns too early. Together you get an early warning, and you can compare it with what the drive itself reports.
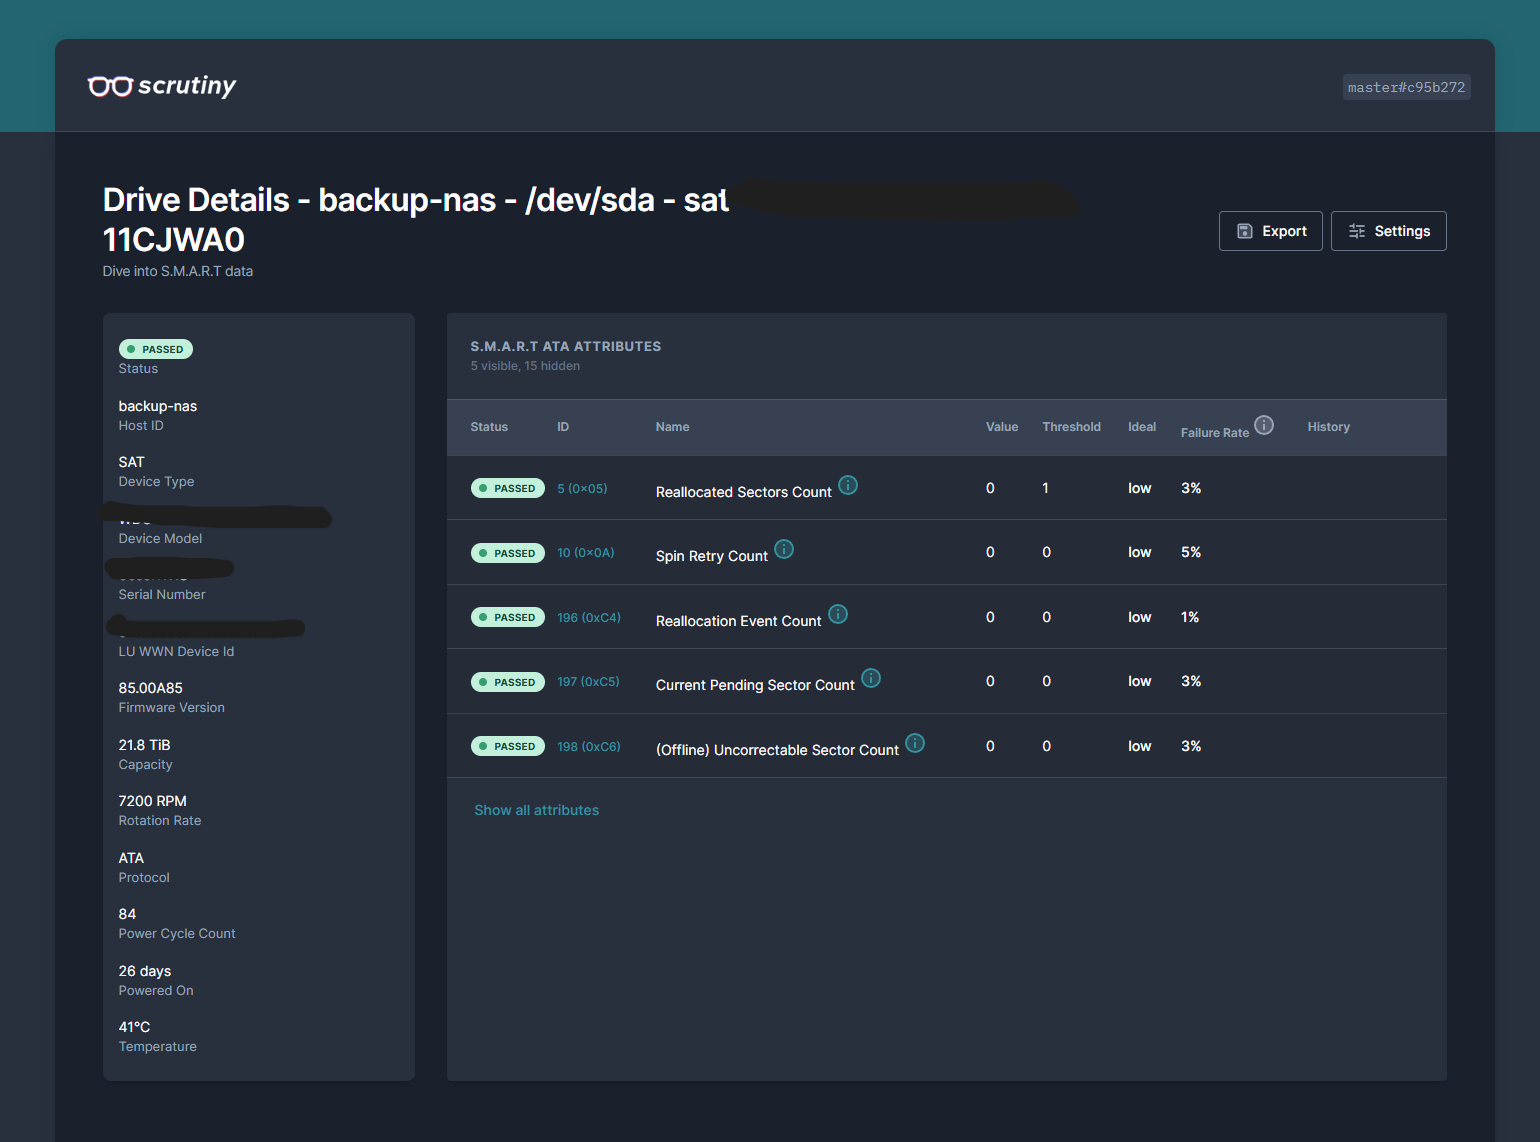
What this is actually for
Not the green badges. They feel good, but they only tell you what you already thought.
It is for the day when one drive's reallocated sector count goes from 0 to 8. SMART still says PASSED, and the drive still works. But your graph shows it was 0 for six months. So you can replace the drive on a Saturday while the array is still healthy. Otherwise you may find out during a rebuild, and that is the worst time for a second disk to be under heavy load.
The temperature history is useful too. A fan that is slowly failing shows up as temperatures rising over weeks, long before any alarm.
Did this guide work for you?
Thank you! That helps me keep this guide right.