A family status page for your homelab with Uptime Kuma
Watch your homelab with Uptime Kuma, get phone alerts, and give your family a simple green or red status page.
Before you start
- A Proxmox server (any version 8 or 9)
- A free IP address on your network for the new container, and an Android or iPhone for the alerts
- Fill in Your values below and every command and address on this page updates to match. Nothing is sent anywhere.
Your values
Fill these in and every command below updates to match. Nothing is sent anywhere.
Run this at your own risk. These steps worked on my hardware; yours may differ. Take a backup first, read each command before running it, and see the disclaimer.
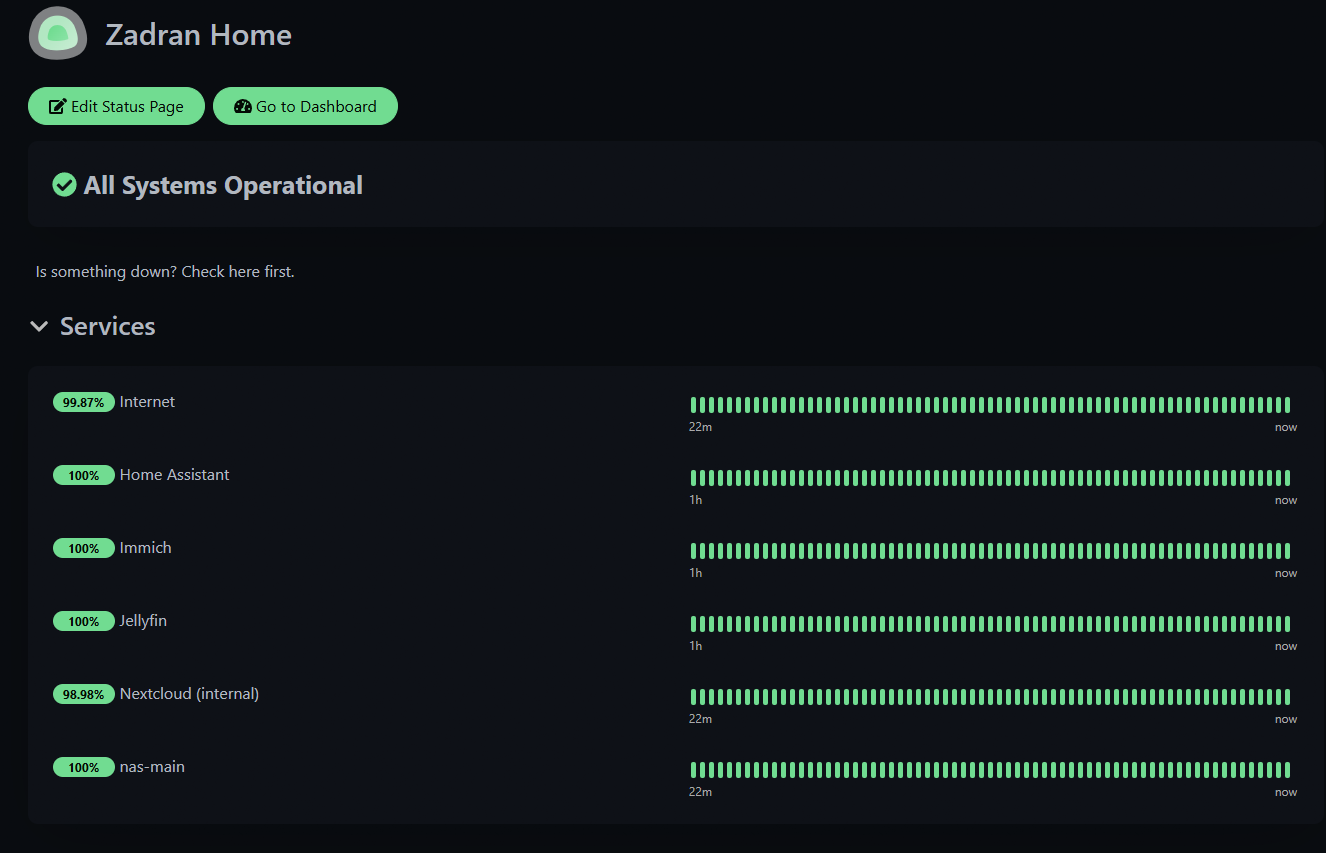
When the internet is slow or the movie app does not load, everyone at home asks the same question: "Is something broken?" In this guide you set up Uptime Kuma. It is a free tool that checks your services every minute and sends an alert to your phone when something goes down. It also shows a simple status page that your family can open themselves.
No programming knowledge needed. You copy the commands, click through a few screens, and you're done in about 45 minutes.
What you will build
| Part | What it gives you |
|---|---|
| 1. Uptime Kuma | A small app that checks your services every minute |
| 2. Phone alerts | A push message on your phone when something goes down, and again when it is back |
| 3. Monitors | One check per service (internet, router, media server, photos…) |
| 4. Status page | A clean page for the family: green means fine, red means broken |
Part 1: Install Uptime Kuma
Uptime Kuma runs in a small Linux container (LXC) on Proxmox, with Docker inside it.
Step 1: Download the container template
Open the Shell of your Proxmox node (click the node name in the left tree → Shell) and paste:
pveam update
TPL=$(pveam available --section system | awk '/debian-13-standard.*_amd64/ {print $2}' | sort -V | tail -1)
echo "Downloading: $TPL"
pveam download local "$TPL"
The echo line must show a name ending in _amd64.tar.zst.
Beginner trap: Proxmox also lists ARM templates (
_arm64). They look almost the same, but they do not run on a normal Intel or AMD PC. The container is created without errors, but then it will not start and shows "Exec format error". The command above only picksamd64, so you are safe.
Step 2: Create the container
Still in the Proxmox shell. Change the IP (192.168.1.50) and the gateway (192.168.1.1) to your own values first:
TPL=$(ls /var/lib/vz/template/cache/ | grep 'debian-13-standard.*_amd64' | sort -V | tail -1)

pct create 150 local:vztmpl/$TPL \
  --hostname uptime \
  --cores 2 --memory 1024 --swap 512 \
  --rootfs local-lvm:8 \
  --net0 name=eth0,bridge=vmbr0,ip=192.168.1.50/24,gw=192.168.1.1 \
  --nameserver 192.168.1.1 \
  --unprivileged 1 --features nesting=1,keyctl=1 \
  --onboot 1

pct start 150
pct status 150
pct exec 150 -- passwd150is the container's ID. Use any number that is still free in your Proxmox.pct statusmust saystatus: running.- The last line asks you to set a root password for the container.
Step 3: Install Docker inside the container
pct exec 150 -- bash -c "apt update && apt full-upgrade -y && apt install -y curl ca-certificates && curl -fsSL https://get.docker.com | sh"
pct exec 150 -- docker version --format '{{.Server.Version}}'
The last line prints a version number, which means Docker is installed.
Step 4: Start Uptime Kuma
Go into the container:
pct enter 150Check that the prompt now starts with root@uptime. Only then paste:
mkdir -p /opt/uptime-kuma
cat > /opt/uptime-kuma/compose.yaml <<'EOF'
services:
  uptime-kuma:
    image: louislam/uptime-kuma:2
    container_name: uptime-kuma
    restart: unless-stopped
    ports:
      - "80:3001"
    volumes:
      - ./data:/app/data
EOF
cd /opt/uptime-kuma && docker compose up -d
sleep 20
docker ps --format '{{.Names}}  {{.Status}}'
Expected result:
uptime-kuma Up 20 seconds (healthy)Type exit to leave the container.
Step 5: First login
Open http://192.168.1.50 in your browser.
- Database: choose SQLite (the simplest choice, and enough for a home network)
- Create your admin username and password
Part 2: Alerts on your phone (ntfy)
ntfy is a free app that receives push messages. No account needed.
Step 6: Make up a secret topic name
A "topic" is like a private channel. Anyone who knows its name can read your alerts, so make it random. In the Proxmox shell:
echo "myhome-alerts-$(openssl rand -hex 6)"Write down the result, for example myhome-alerts-3f9a1c2b7e4d.
Step 7: Subscribe on your phone
- Install the ntfy app (Play Store or App Store) and allow notifications.
- Tap +, type your topic name by hand, and tick "Instant delivery, even when phone is idle".
- Tap Subscribe.
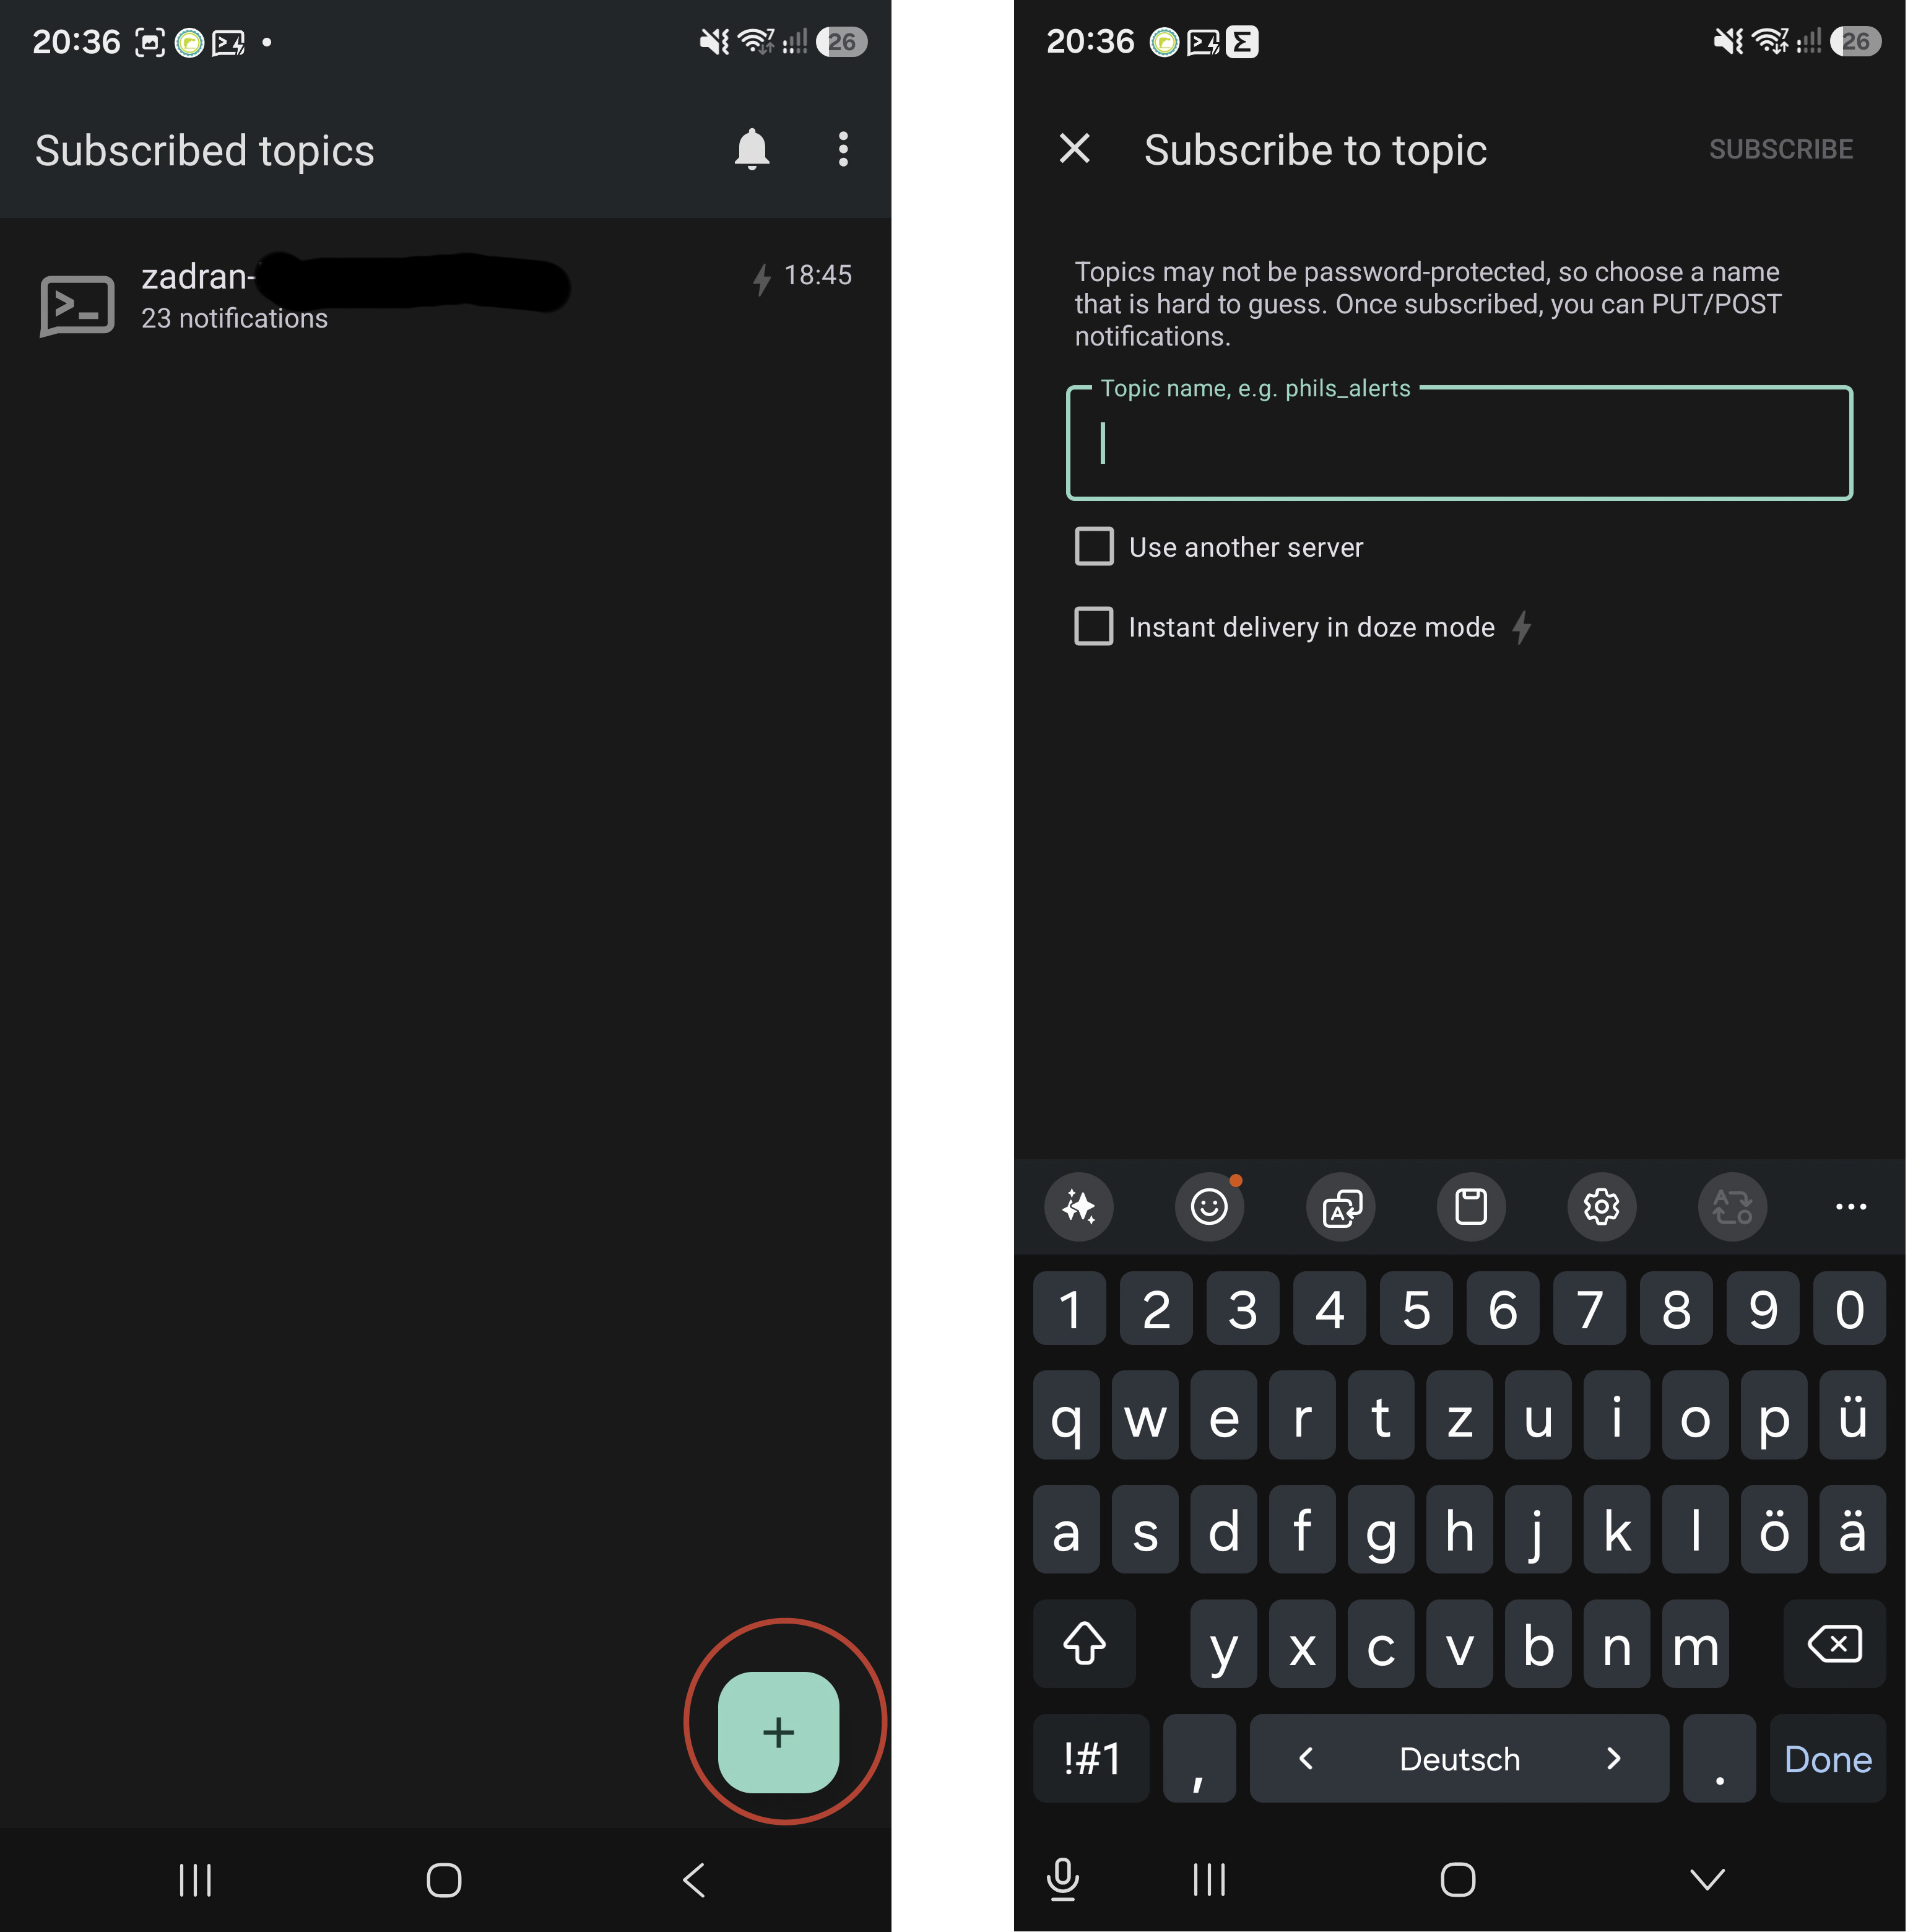
Samsung and other Android phones: go to Settings → Apps → ntfy → Battery and choose Unrestricted. Otherwise the phone puts ntfy to sleep and alerts arrive late.
Step 8: Test it
From the Proxmox shell (use your own topic name):
curl -H "Title: Homelab test" -d "Hello from my server" ntfy.sh/myhome-alerts-3f9a1c2b7e4dA notification pops up on your phone within a few seconds.
Step 9: Connect Uptime Kuma to ntfy
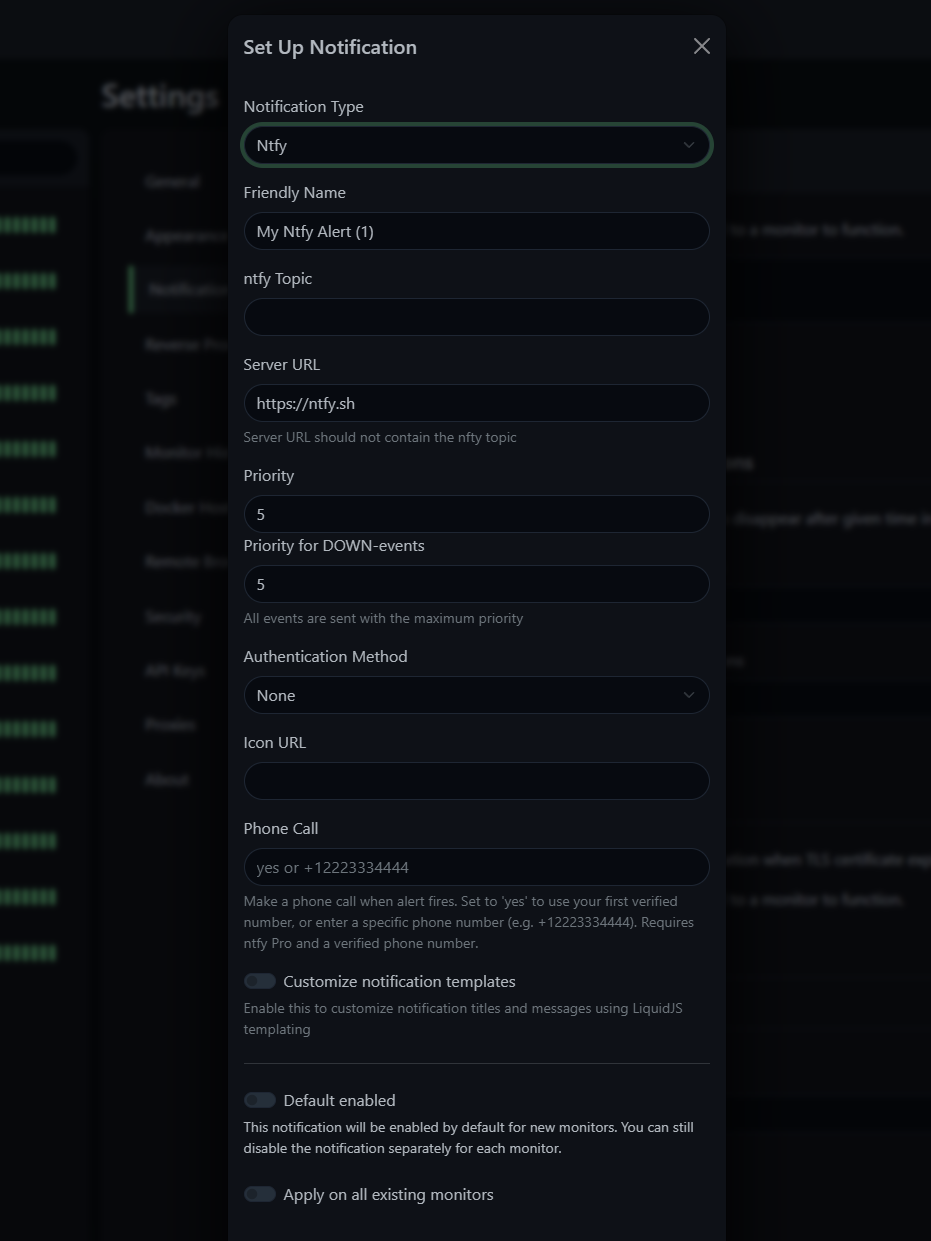
In Uptime Kuma: Settings → Notifications → Setup Notification
| Field | Value |
|---|---|
| Notification Type | ntfy |
| Friendly Name | Phone |
| ntfy Topic | your topic name |
| Server URL | https://ntfy.sh |
| Priority | 5 |
| Default enabled | ✅ |
| Apply on all existing monitors | ✅ |
Click Test. When the message arrives on your phone, click Save.
If the test says "topic invalid": there is an invisible space before or after the topic name. This happens when you copy and paste. Delete the field and type the name by hand.
Part 3: Add your monitors
Each monitor checks one thing. Click + Add New Monitor, fill in the form, and click Save. For every monitor use:
- Heartbeat Interval:
60(check every minute) - Retries:
1(one more try before the alarm, which avoids false alarms) - Heartbeat Retry Interval:
20 - On the right side: Phone notification ✅
The basic monitors
| Friendly Name | Monitor Type | URL / Hostname | Extra |
|---|---|---|---|
| Internet | Ping | 1.1.1.1 |
|
| Router | Ping | 192.168.1.1 |
|
| NAS | HTTP(s) | https://192.168.1.10 |
Tick Ignore TLS/SSL errors |
Do not monitor things that are meant to be off. A backup machine that only runs at night, a laptop, a test VM: if you add those, Uptime Kuma sends an alarm every day. The alarm is correct, but after a week nobody reads the alerts any more. Too many alarms make monitoring useless. Monitor only what should always be up.
Family services (use their built-in health checks)
A simple "is the page there?" check can be green even when the app is broken. These services have a special address that only answers correctly when they really work. Use HTTP(s) – Keyword:
| Friendly Name | URL | Keyword |
|---|---|---|
| Jellyfin | http://192.168.1.10:30013/health |
Healthy |
| Immich | http://192.168.1.10:30041/api/server/ping |
pong |
| Home Assistant | http://192.168.1.20:8123/manifest.json |
Home Assistant |
| Nextcloud | http://192.168.1.30/status.php |
"maintenance":false |
Replace the IP addresses and ports with your own. On TrueNAS you find an app's port under Apps → click the app.
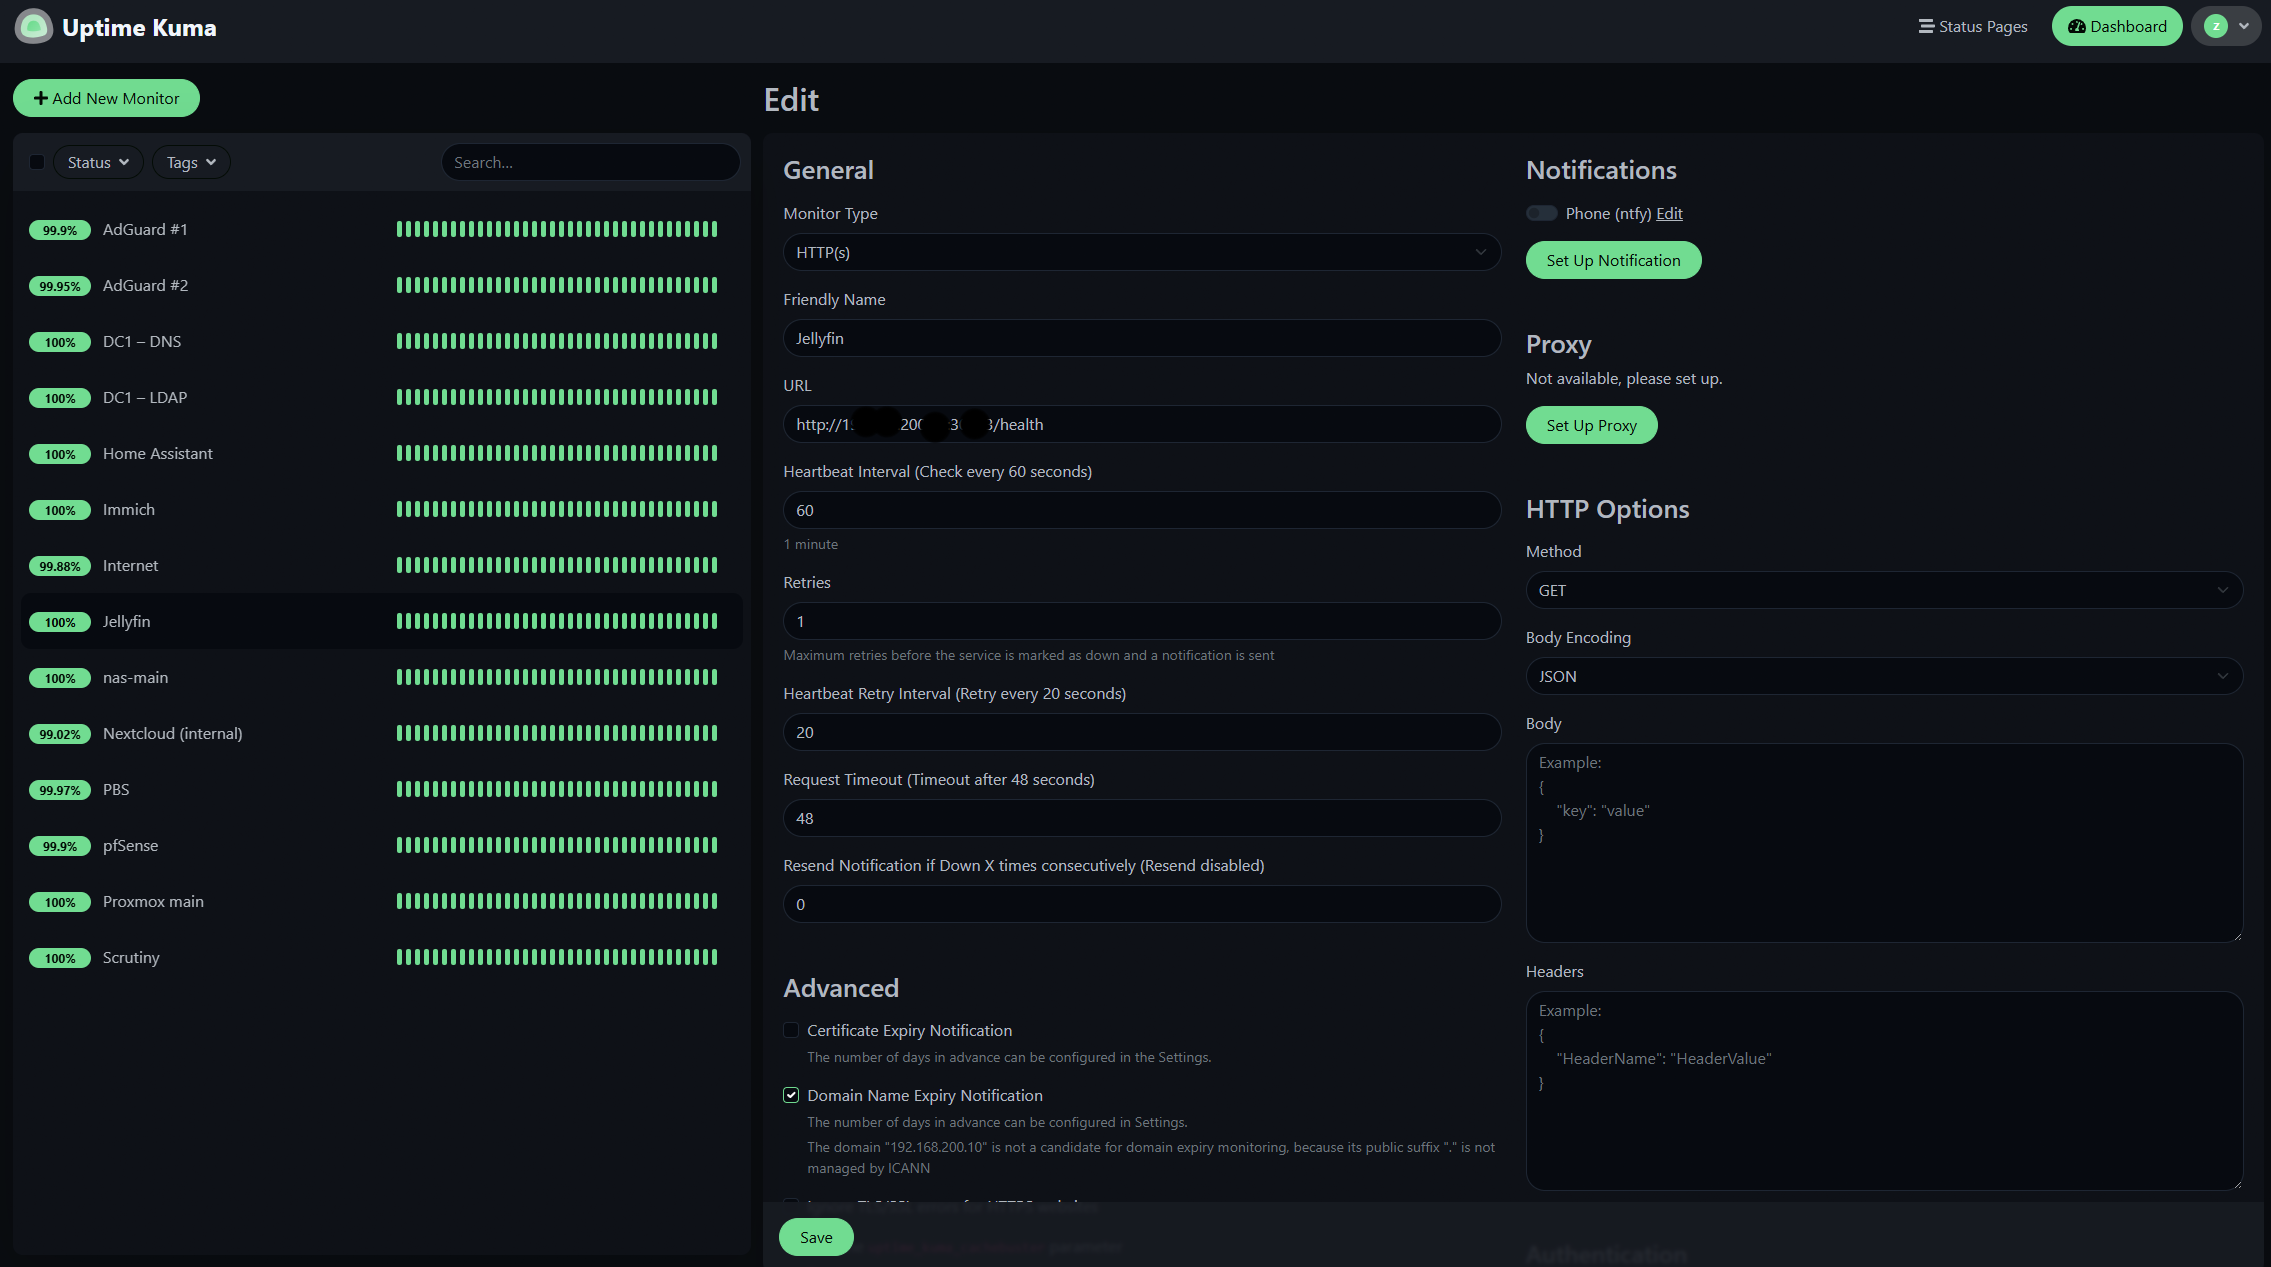
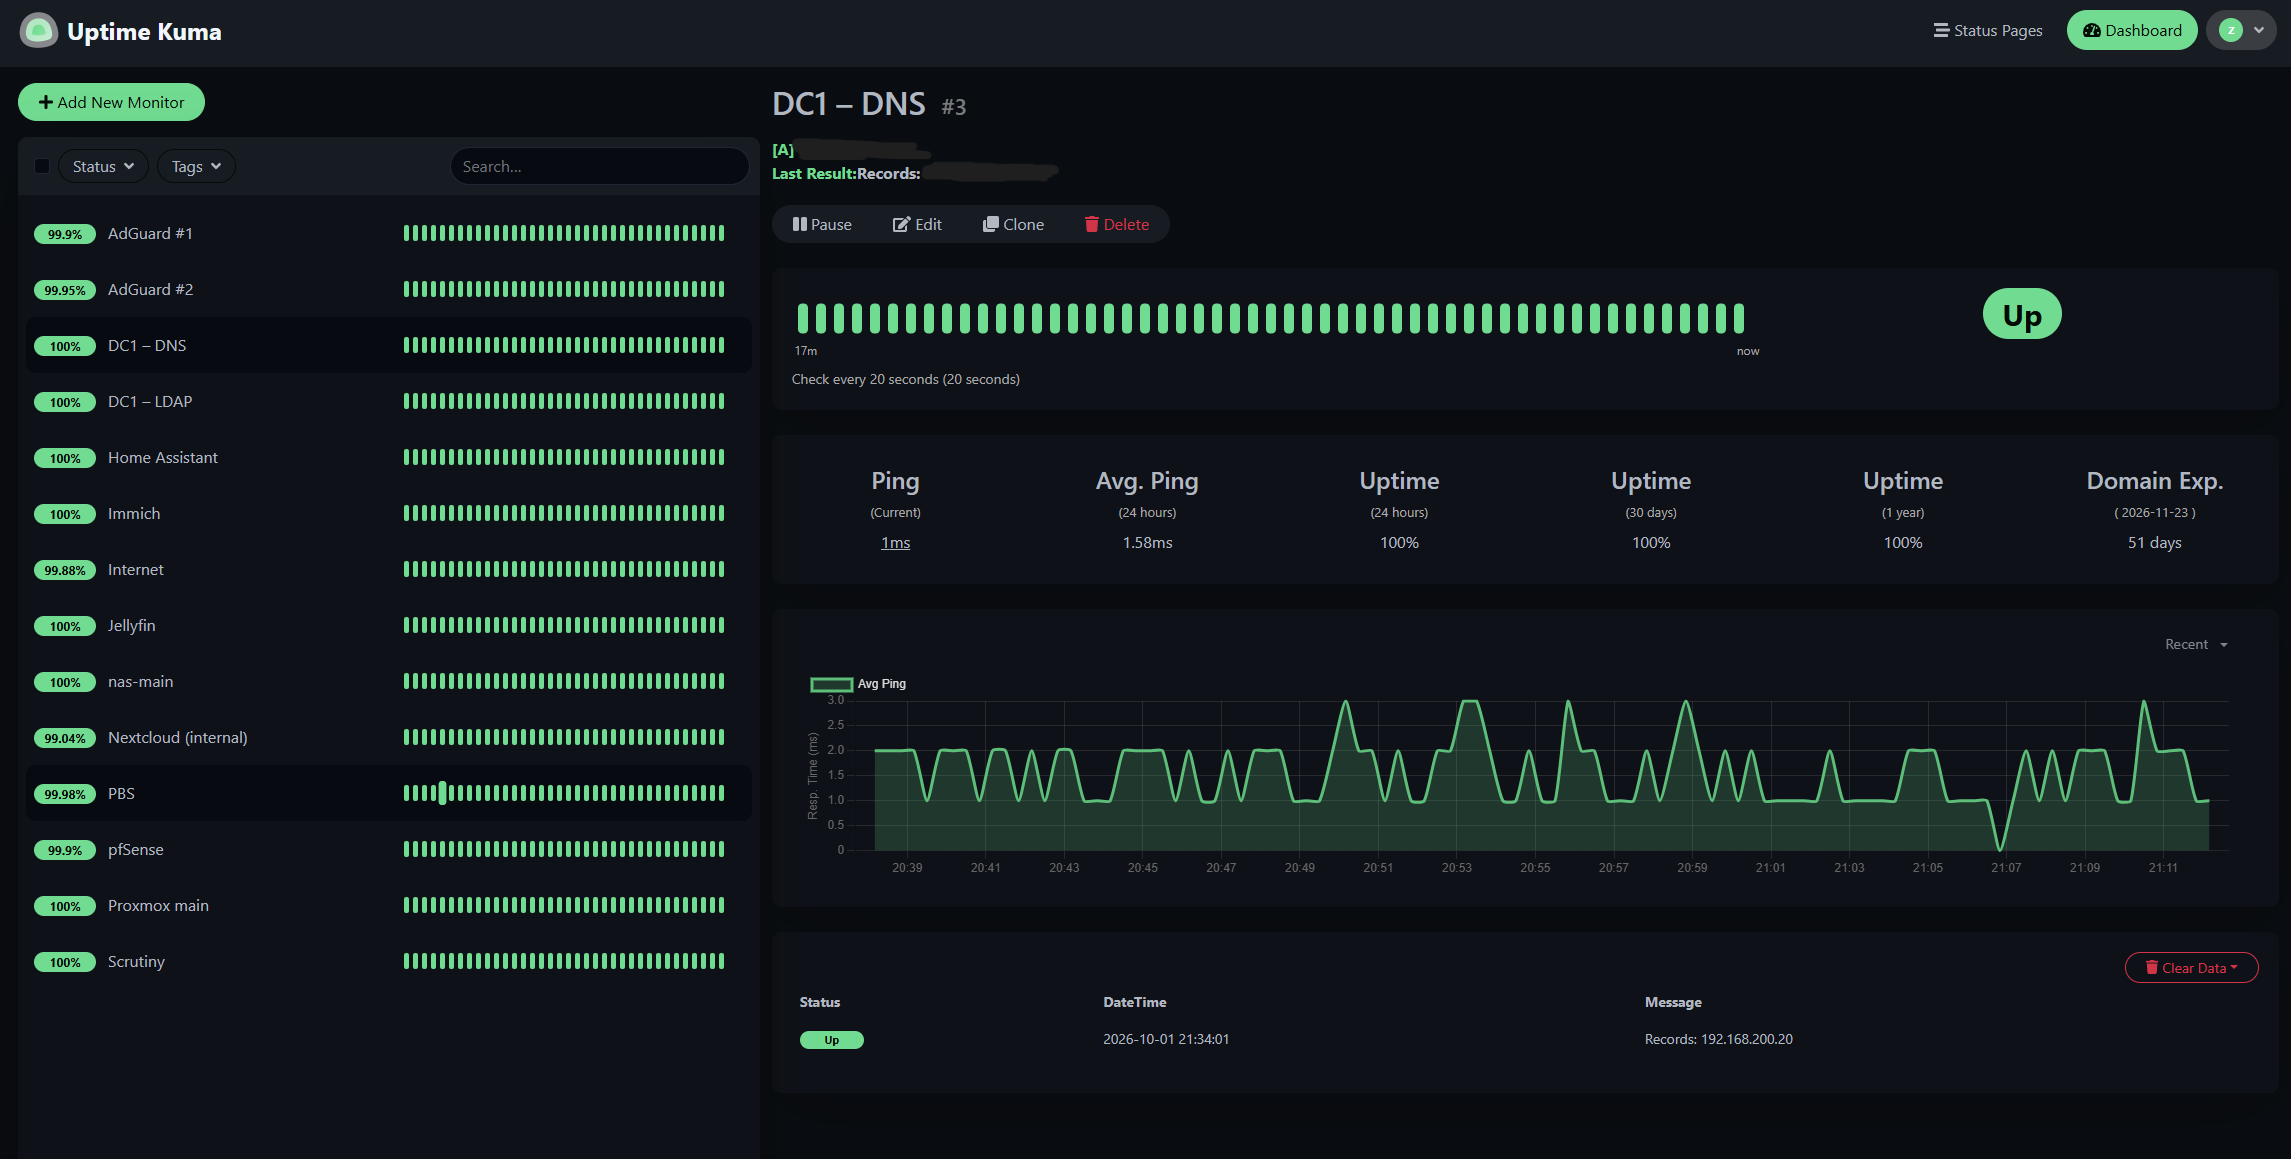
After a minute, everything should be green:
Test an alert (recommended)
Switch one service off for 2 minutes, for example stop a container in Proxmox. Your phone should get a DOWN message, and an UP message when you start it again. Now you know alerts really reach you.
Part 4: The family status page
Step 10: Create the page
- In Uptime Kuma, top right: Status Pages → + New Status Page
- Name:
Home, Slug:home→ Next
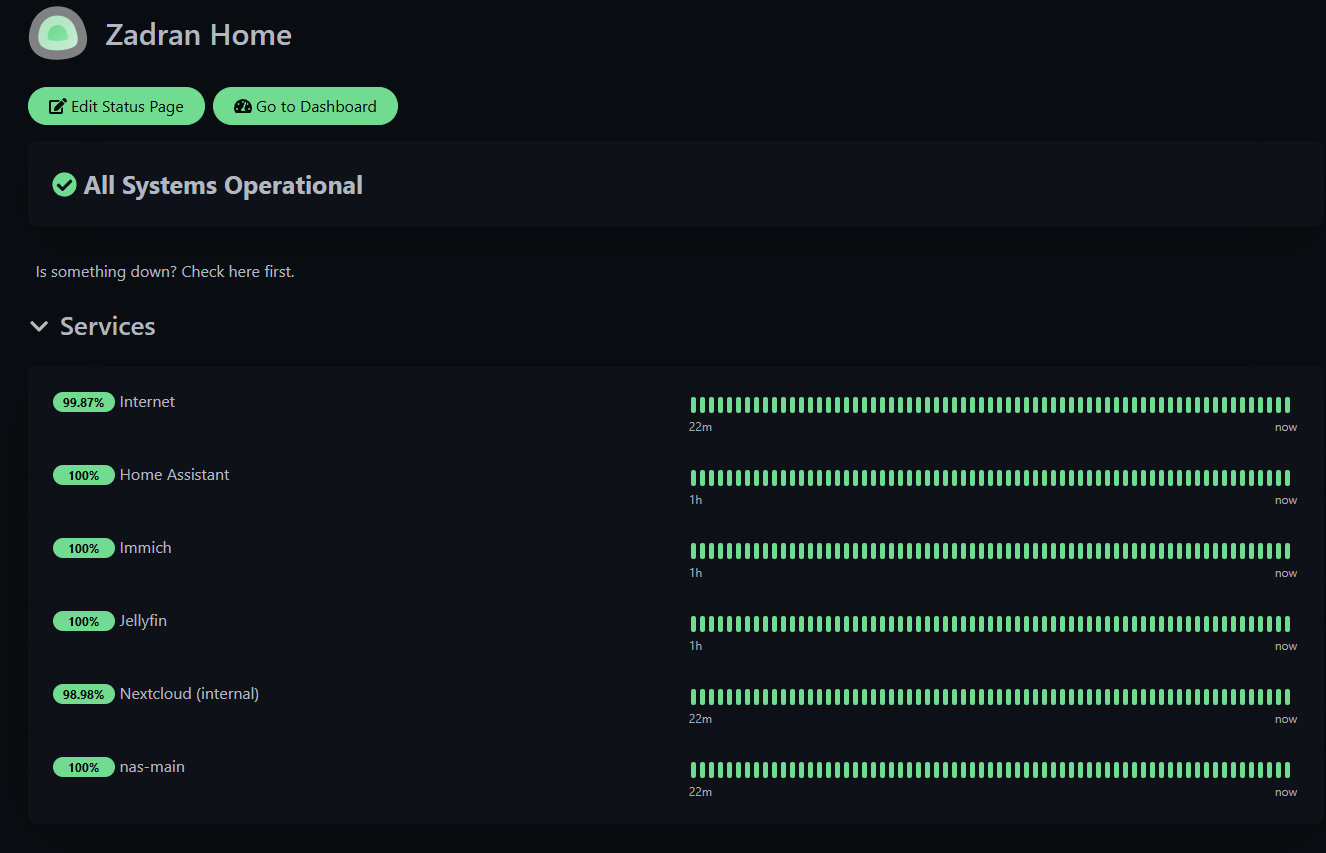
Step 11: Choose what the family sees
The editor opens.
- Description (optional):
Is something down? Check here first. - Click + Add Group and name it
Internet. In Add a monitor, choose Internet. - Click + Add Group and name it
Family Services. Add Jellyfin, Immich, Nextcloud and Home Assistant. - In the left sidebar:
- Show Tags: off
- Show Certificate Expiry: off
- Theme: Auto
- Click Save.
Tip: keep technical monitors (router, NAS, servers) off this page. The family only needs to know whether their things work.
Step 12: Put it on the family's phones
The page is at:
http://192.168.1.50/status/homeIt needs no login.
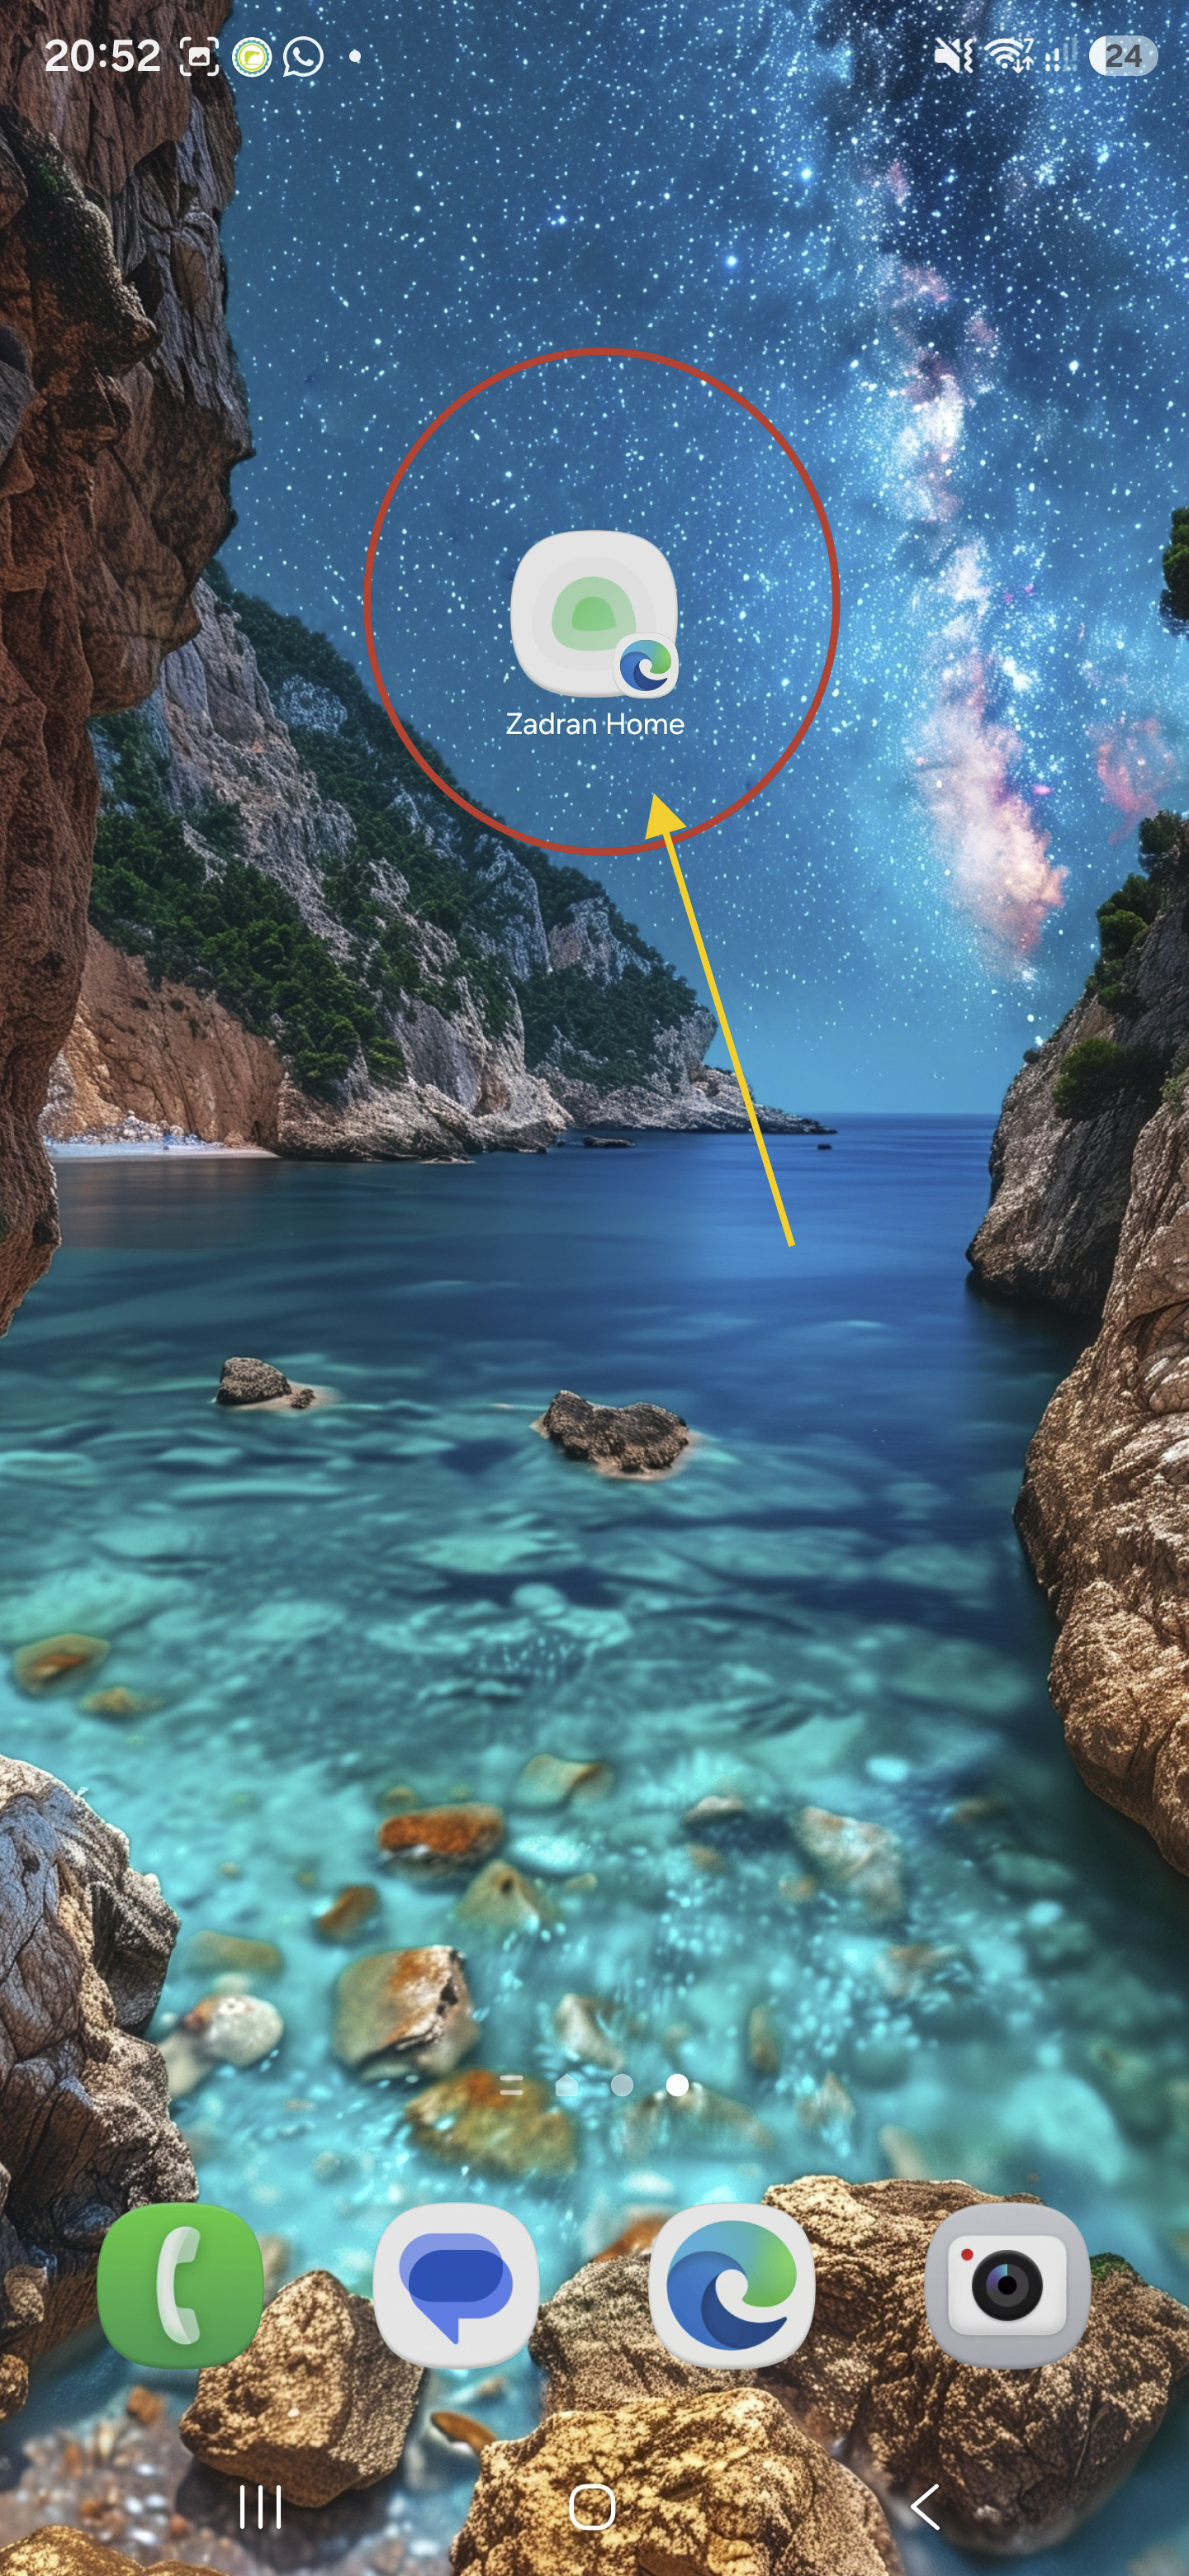
On each phone, open that address in the browser, then:
- Android (Chrome): ⋮ → Add to Home screen
- iPhone (Safari): Share → Add to Home Screen
Name it Home Status. It now appears like an app icon.
The page works on your home Wi-Fi. Away from home it only works if the phone is connected to your home network through a VPN such as Tailscale.
Part 5: Who watches the watchman?
Uptime Kuma cannot tell you that Uptime Kuma itself is down. If its container stops, or the server loses power, your phone stays quiet and everything looks fine. Silence and "all good" look the same. This is the one problem this setup cannot see by itself.
The fix is free: an outside service expects a message every few minutes and warns you when no message arrives.
Step 13: Create the check
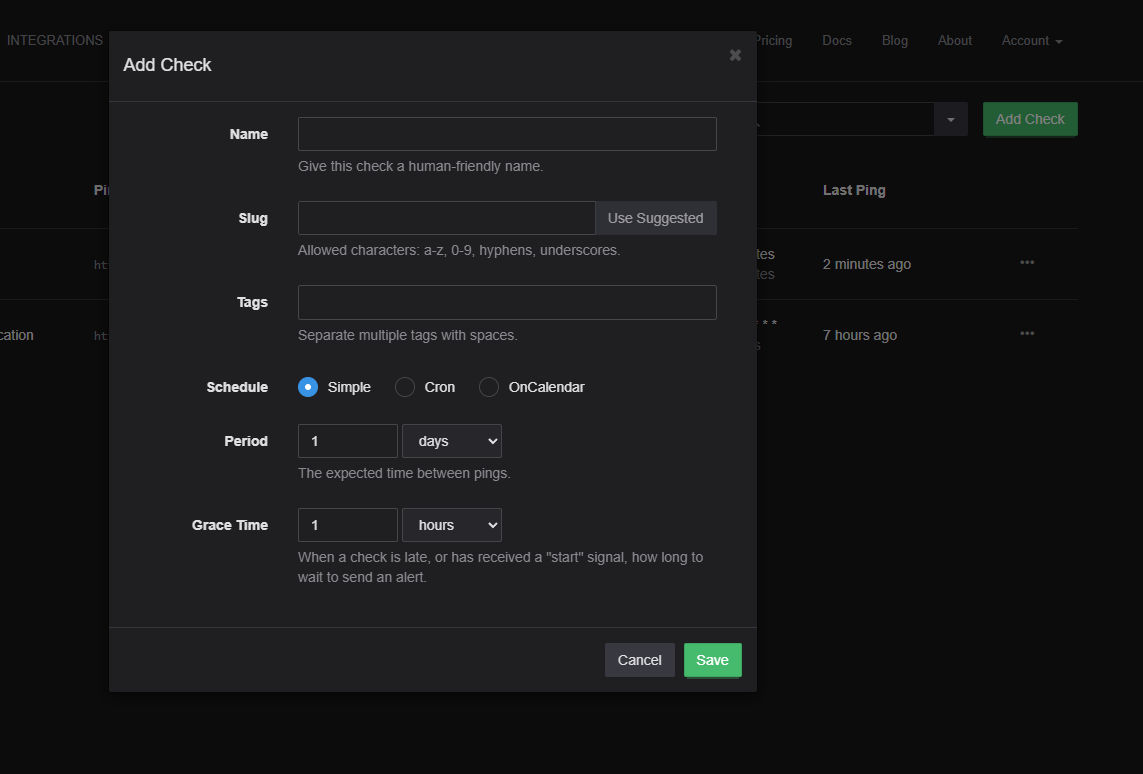
- Sign up at healthchecks.io (free) and click Add Check.
- Name:
Homelab monitor— Period: 5 minutes — Grace: 5 minutes. - Copy its ping URL. It looks like
https://hc-ping.com/your-check-uuid. - Top menu Integrations → ntfy: your topic, server
https://ntfy.sh, down priority High → Save, then Test!
Step 14: Ping it from the Proxmox host
Run this in the Proxmox shell, not inside the container. The check must come from outside the thing it checks.
cat > /etc/cron.d/healthchecks-kuma <<'EOF'
*/5 * * * * root curl -fsS -m 10 -o /dev/null http://192.168.1.50/ && curl -fsS -m 10 --retry 3 -o /dev/null https://hc-ping.com/your-check-uuid
EOF
Read that line from left to right. It asks Uptime Kuma for its page, and only if that works, it pings healthchecks.io. So one check covers both the server and the app. If either stops, the pings stop and your phone gets an alert.
Step 15: Prove it works
pct stop 150Within about ten minutes your phone gets a DOWN alert. Then start it again and an UP alert follows:
pct start 150A healthy check is completely silent. healthchecks.io only sends a message when something changes. That is correct, but it also makes it easy to believe the alerts work when you have never tested them. Test it:
curl https://hc-ping.com/your-check-uuid/fail
How to read the status page
| What the family sees | What it means |
|---|---|
| Everything green | All fine. The problem is probably the device itself. Restart it. |
| Internet red | The internet connection is down. Nothing at home can fix that. Wait, or call the provider. |
| One service red | Only that app is down, and you already got an alert on your phone. |
Troubleshooting
| Problem | Fix |
|---|---|
| Container won't start: "Exec format error" | The wrong (ARM) template was downloaded. Delete the container, then repeat Steps 1 and 2. |
| ntfy test: "topic invalid" | Invisible space in the topic name. Type it by hand. |
| No phone alert when a monitor goes red | Open the monitor → Edit → tick Phone under Notifications → Save. |
| Alerts arrive late | Set ntfy's battery mode to Unrestricted and tick Instant delivery in the app. |
| Keyword monitor red: "keyword not found" | The app answers, but not as expected. Open the URL in your browser and check the exact word. |
| An alert every day at the same time | Something that is meant to be off is being monitored. Remove that monitor. |
| healthchecks.io never alerts | It only sends a message when something changes. Test it with the /fail URL above. |
Did this guide work for you?
Thank you! That helps me keep this guide right.