Homelab monitoring, Part 8: Backup monitoring with Proxmox Backup Server
See the last backup of every VM and container, find guests with no backup, and know when storage will be full.
Before you start
- The monitoring stack from Parts 1 to 4, with the pve-exporter from Part 2 covering every Proxmox host.
- A Proxmox Backup Server that your Proxmox hosts back up to.
- Fill in Your values below and every command on this page updates to match.
Files for this guide
The commands below download these for you. Open one to read it, or import a dashboard by hand.
pbs-backups.json— Grafana dashboard: backups on Proxmox Backup Serverpbs.yaml— Grafana alert rules: backups
Your values
Fill these in and every command below updates to match. Nothing is sent anywhere.
Run this at your own risk. These steps worked on my hardware; yours may differ. Take a backup first, read each command before running it, and see the disclaimer.
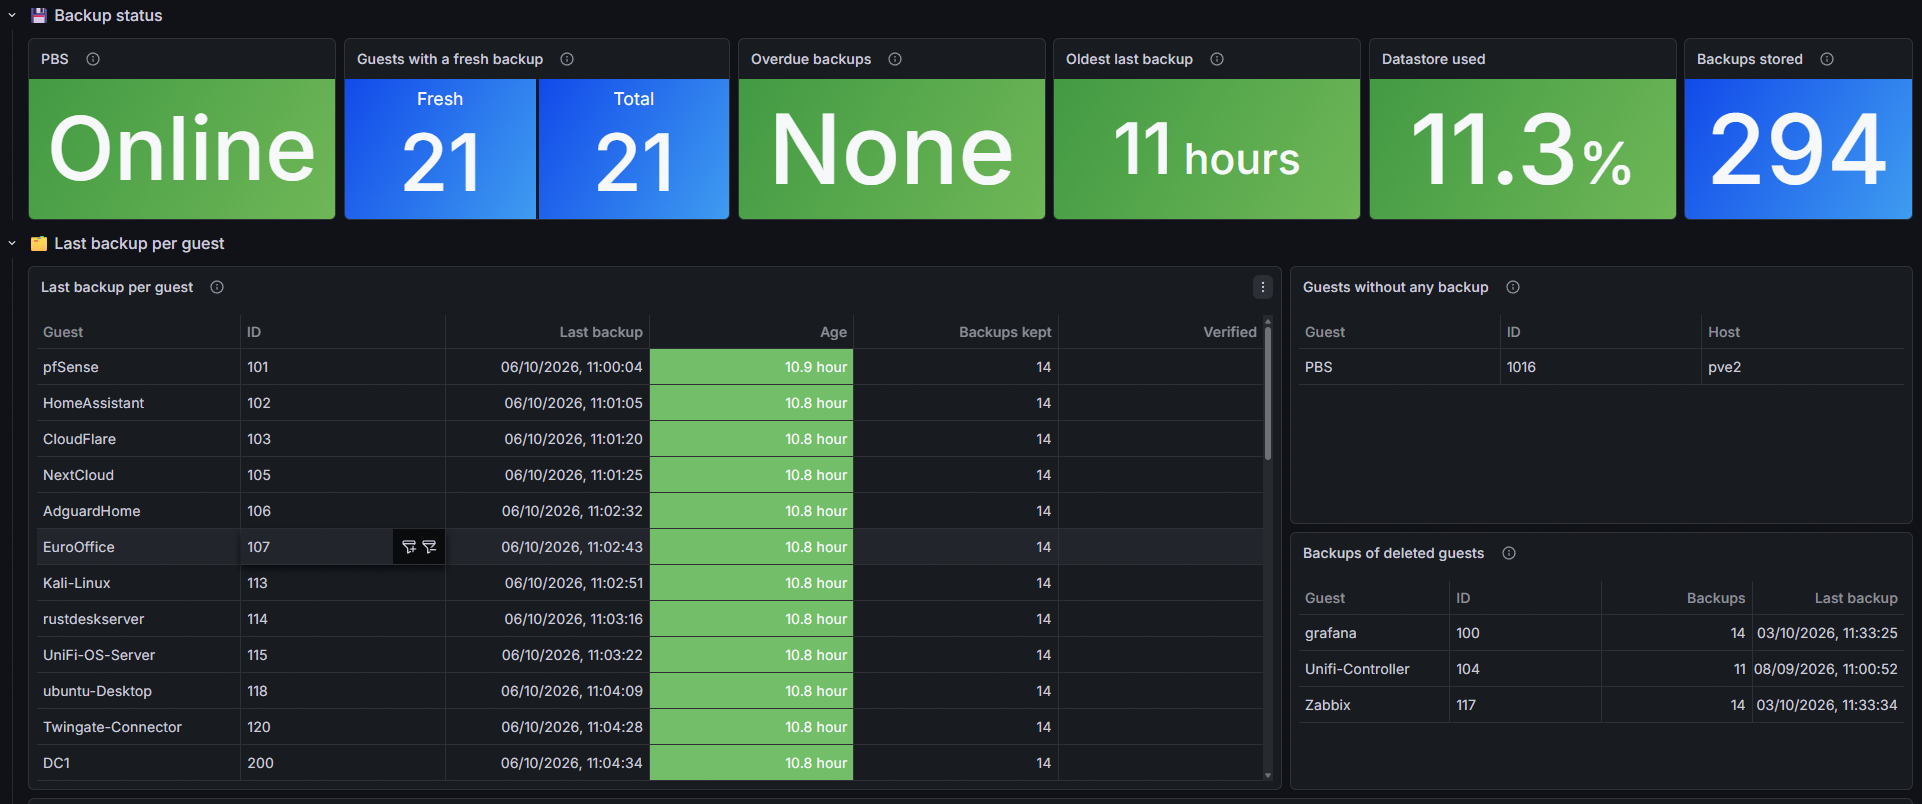
If you never check a backup, you only hope it works. Proxmox Backup Server (PBS) shows a green tick for each job. But it does not tell you when one VM is no longer backed up, or when the datastore will be full. This part connects PBS to Prometheus and adds a dashboard and three alerts:
| Section | Shows |
|---|---|
| Backup status | PBS online, how many guests have a fresh backup, overdue backups, the oldest "last backup", datastore use |
| Last backup per guest | One row per VM and container: last backup, age, backups kept, verified or not |
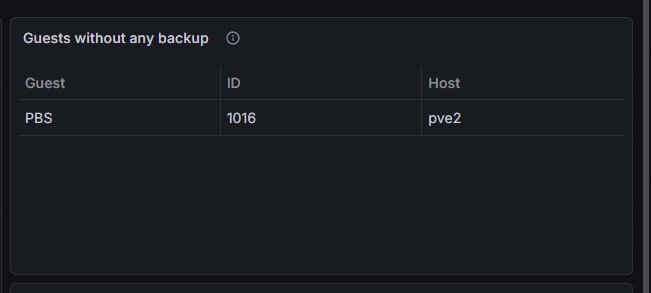
| Guests without any backup | Existing VMs and containers that PBS has never seen |
| Backups of deleted guests | Old backups taking space for guests that no longer exist |
| Datastore | Usage over time and a forecast: days until 80 % full |
| PBS server | CPU, memory, disk, IO wait, version |
The alerts:
| Alert | Fires when |
|---|---|
| Backup overdue | A guest that still exists has no backup younger than 30 hours (adjustable in Step 5). |
| Backup datastore above 80% | For 30 minutes. Garbage collection needs free space to work, so do not wait until 95 %. |
| Backup server not answering | PBS does not answer the exporter for 15 minutes. |
The dashboard only lists guests that still exist in Proxmox. It gets this list from the pve-exporter of Part 2, so a VM you deleted months ago does not stay red forever. All your Proxmox hosts must be in the pve job from Part 2.
Step 1: A read-only user and token in PBS
Open the PBS web interface → your PBS node → Shell (or SSH into PBS) and run:
proxmox-backup-manager user create prometheus@pbs --comment "Monitoring (read-only)"
proxmox-backup-manager acl update / Audit --auth-id prometheus@pbs
proxmox-backup-manager user generate-token prometheus@pbs exporter
proxmox-backup-manager acl update / Audit --auth-id 'prometheus@pbs!exporter'
The third command prints the token. Copy the value now, because PBS shows it only once.
Result: {
  "tokenid": "prometheus@pbs!exporter",
  "value": "a1b2c3d4-xxxx-xxxx-xxxx-xxxxxxxxxxxx"
}| Command | Why |
|---|---|
Role Audit |
May read everything (datastores, backup lists, server status), change nothing, delete nothing |
The acl update for the token as well |
In PBS a token gets only the rights that both the user and the token have. With only one of the two lines, the exporter logs in but sees no backups. |
Step 2: Save the token in the monitoring container
The token goes into its own file, which only Docker reads. Never put it into a compose file. From the Proxmox host shell where the monitoring container runs:
pct enter 140Inside the container, paste the token when you are asked. It is not shown while you paste. Press Enter after it.
mkdir -p /opt/monitoring/pbs && chmod 700 /opt/monitoring/pbs
read -rsp "PBS token value: " T && printf '%s\n' "$T" | tr -d ' \r' > /opt/monitoring/pbs/token && unset T && echo
chmod 644 /opt/monitoring/pbs/token
grep -cE '^[0-9a-f]{8}-[0-9a-f]{4}-[0-9a-f]{4}-[0-9a-f]{4}-[0-9a-f]{12}$' /opt/monitoring/pbs/token
The last line must print 1. A 0 means the paste went wrong. Run the read line again.
The folder is closed (
700), so nobody in the container can open it and find the token. The file itself must stay readable (644), because the exporter runs as a normal user without root rights inside Docker.
Step 3: The exporter
pbs-exporter reads the PBS API and turns it into numbers for Prometheus.
cd /opt/monitoring
mkdir -p backup
cp compose.override.yaml backup/compose.override.yaml.$(date +%Y%m%d-%H%M%S) 2>/dev/null
[ -f compose.override.yaml ] || echo "services:" > compose.override.yaml
cat >> compose.override.yaml <<'EOF'

  pbs-exporter:
    image: ghcr.io/natrontech/pbs-exporter:latest
    container_name: pbs-exporter
    restart: unless-stopped
    user: '65534'
    environment:
      - PBS_ENDPOINT=https://192.168.1.30:8007
      - PBS_INSECURE=true
      - PBS_USERNAME=prometheus@pbs
      - PBS_API_TOKEN_NAME=exporter
      - PBS_API_TOKEN_FILE=/run/secrets/pbs_token
      - PBS_TIMEOUT=30s
    volumes:
      - ./pbs/token:/run/secrets/pbs_token:ro
EOF
docker compose config -q && docker compose up -d pbs-exporter| Setting | Why |
|---|---|
PBS_INSECURE=true |
PBS uses its own self-signed certificate. The connection is still encrypted. Only the certificate is not checked. |
PBS_API_TOKEN_FILE |
Reads the token from the file of Step 2, not from an environment variable, so docker inspect does not show it |
user: '65534' |
Runs as nobody, not as root |
Step 4: The Prometheus job
P=/opt/monitoring/prometheus/prometheus.yml
cp $P /opt/monitoring/backup/prometheus.yml.$(date +%Y%m%d-%H%M%S)
cat >> $P <<'EOF'

  - job_name: pbs
    scrape_interval: 2m
    scrape_timeout: 60s
    static_configs:
      - targets: ['pbs-exporter:10019']
        labels:
          host: pbs
EOF
docker exec prometheus promtool check config /etc/prometheus/prometheus.yml && curl -fsS -X POST localhost:9090/-/reload && echo reloaded
Each time Prometheus collects data, the exporter asks PBS for the full list of backups. Every 2 minutes is enough for backups that run once a day, and it does not put load on PBS.
Check that it works:
docker exec prometheus wget -qO- --timeout=60 http://pbs-exporter:10019/metrics | grep -E '^pbs_up |^pbs_size\{|^pbs_snapshot_vm_last_timestamp\{' | cut -c1-110 | head -5pbs_size{datastore="backup"} 3.83e+12
pbs_snapshot_vm_last_timestamp{datastore="backup",namespace="",vm_id="100",vm_name="dc1"} 1.7911e+09
pbs_snapshot_vm_last_timestamp{datastore="backup",namespace="",vm_id="101",vm_name="homeassistant"} 1.7911e+09
pbs_snapshot_vm_last_timestamp{datastore="backup",namespace="",vm_id="102",vm_name="adguard"} 1.7911e+09
pbs_up 1pbs_up 1 means PBS accepted the login. If it is 0, see the troubleshooting table.
Step 5: Dashboard and alerts
Both files are made for a 30-hour limit. This command downloads them and writes your limit from Your values into them. With the default 30, nothing changes.
H=30
curl -fsSL https://www.zadran.net/downloads/grafana/dashboards/pbs-backups.json | sed -e "s/ < 30)/ < $H)/; s/ >= 30)/ >= $H)/; s/30 hours/$H hours/g; s/30 h\([ .]\)/$H h\1/g; s/\"value\": 30\$/\"value\": $H/; s/\"value\": 26\$/\"value\": $((H-4))/; s/\"value\": 93600\$/\"value\": $(((H-4)*3600))/; s/\"value\": 108000\$/\"value\": $((H*3600))/" > /opt/monitoring/grafana/provisioning/dashboards/files/Servers/pbs-backups.json
curl -fsSL https://www.zadran.net/downloads/grafana/alerting/pbs.yaml | sed -e "s/params: \[30\]/params: [$H]/" > /opt/monitoring/grafana/provisioning/alerting/pbs.yaml
grep -c "$H" /opt/monitoring/grafana/provisioning/alerting/pbs.yaml
cd /opt/monitoring && docker compose restart grafana
grep prints at least 1. After about 30 seconds the dashboard is under Servers → Backups (Proxmox Backup Server), and the three rules under Alerting → Alert rules → Homelab Alerts → backups.
| Your backups run | MAX_HOURS |
|---|---|
| Daily | 30 (one day plus 6 hours for a slow or late job) |
| Twice a day | 16 |
| Weekly | 180 (7 days plus 12 hours) |
Step 6: Prove the alert works
If you have never seen an alert fire, you only hope it works. A safe test: back up a small, unimportant container only once and wait until the backup is too old. Or simply look at the table the next morning.
- Last backup per guest: every row should show an age below 24 hours the morning after your backup job.
- Guests without any backup: anything listed here is not in any backup job. Add it in Proxmox under Datacenter → Backup, or leave it out on purpose (a PBS VM usually does not back up itself).
- Verified: shows Not yet until your verify job has run once. If you have no verify job, create one in PBS under Datastore → your datastore → Verify Jobs. A backup that was never read back is not proven to work.
Troubleshooting
| Problem | Fix |
|---|---|
pbs_up 0, log says 401 or authentication failure |
Token value wrong. Repeat Step 2, then docker compose restart pbs-exporter. |
pbs_up 1 but no pbs_snapshot_… lines |
Only one of the two acl update lines ran. Run both from Step 1. |
Log says no such file for /run/secrets/pbs_token |
The token file didn't exist when the container started. Do Step 2, then docker compose up -d --force-recreate pbs-exporter. |
| Log says permission denied reading the token | chmod 644 /opt/monitoring/pbs/token and restart the exporter. |
| Scrapes time out | Very many backups make the API slow. Raise PBS_TIMEOUT=60s and scrape_timeout: 90s (and scrape_interval: 3m). |
Table is empty, pbs_snapshot_… lines exist |
The dashboard joins with pve_guest_info from Part 2. Check that the pve job is up and covers every Proxmox host. |
| A guest shows twice | Two Proxmox hosts use the same VM ID. Give every guest a unique ID across hosts; PBS can't tell them apart either. |
This completes the series so far: the stack, every server, dashboards, alerts, the whole house, the internet line and the backups, all in one Grafana.
Did this guide work for you?
Thank you! That helps me keep this guide right.