Homelab monitoring, Part 2: Every VM, the NAS and the Wi-Fi
Add every Proxmox VM and container, your TrueNAS and your UniFi devices to the monitoring from Part 1.
Before you start
- The monitoring stack from Part 1.
- Any of: a Proxmox host, a TrueNAS SCALE NAS (24.10 or newer), a UniFi network. Each section stands on its own; skip what you don't have.
- Fill in Your values below and every command on this page updates to match.
Your values
Fill these in and every command below updates to match. Nothing is sent anywhere.
Run this at your own risk. These steps worked on my hardware; yours may differ. Take a backup first, read each command before running it, and see the disclaimer.
In Part 1 you built Prometheus and Grafana and connected the Proxmox host. Now you add the rest of the homelab:
| Source | What you get | Exporter |
|---|---|---|
| Proxmox | CPU, RAM, disk and network of every VM and container | pve-exporter |
| TrueNAS | CPU, RAM, temperatures, and pool usage and health | node_exporter + a small script |
| UniFi | Access points, switches, connected clients | Unpoller |
Each section stands on its own. Skip what you don't have.
A. Proxmox: all VMs and containers (pve-exporter)
The node_exporter from Part 1 only sees the host itself. pve-exporter asks the Proxmox API about every guest. It gets its own read-only user.
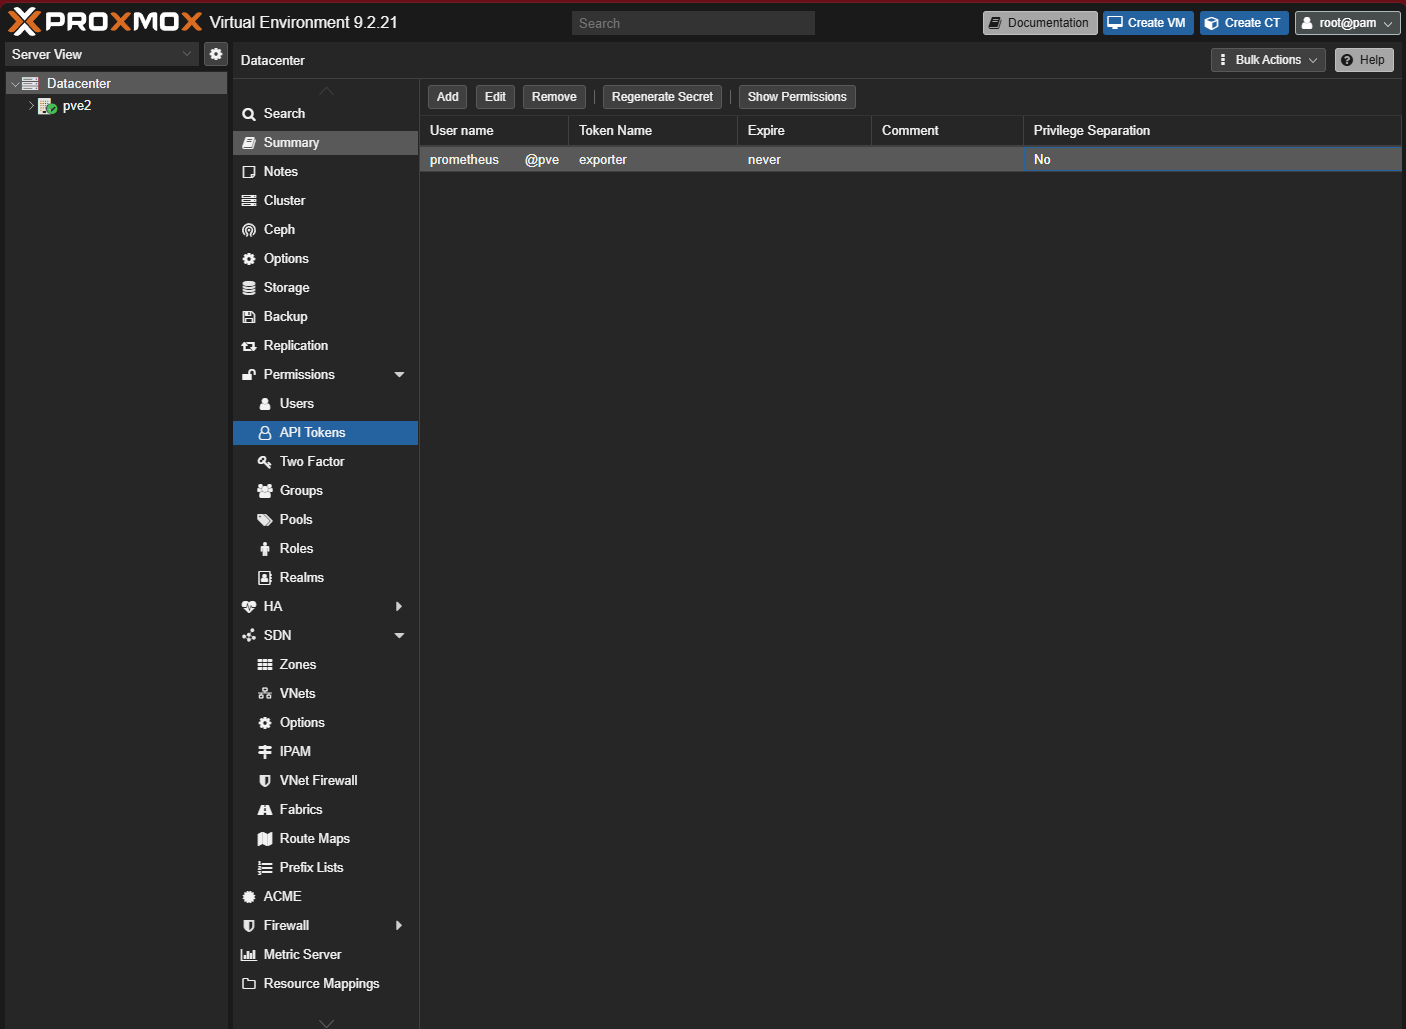
A1. Create a read-only user and token (Proxmox host shell)
pveum user add prometheus@pve --comment "Monitoring (read-only)"
pveum acl modify / --users prometheus@pve --roles PVEAuditor
pveum user token add prometheus@pve exporter --privsep 0
The last command prints a table with a value like a1b2c3d4-…. Copy it now; Proxmox shows it only once.
| Option | Why |
|---|---|
Role PVEAuditor |
May read everything, change nothing |
--privsep 0 |
The token gets the same rights as the user. Without it the token has no rights and the exporter sees nothing. |
A2. Save the token (monitoring container)
pct enter 140        # from the Proxmox host shell
nano /opt/monitoring/prometheus/pve.yml
Type this, with your token value, then save (Ctrl + O, Enter, Ctrl + X):
pve:
  user: prometheus@pve
  token_name: exporter
  token_value: a1b2c3d4-xxxx-xxxx-xxxx-xxxxxxxxxxxx
verify_ssl: falsepve: is the name of this Proxmox server. The job below uses this name again. If you have two Proxmox hosts, add a second block (for example pve2:) with its own token.
A3. Add the exporter and the job
New services go into a second compose file, compose.override.yaml. Docker reads it automatically together with compose.yaml.
cat > /opt/monitoring/compose.override.yaml <<'EOF'
services:
  pve-exporter:
    image: prompve/prometheus-pve-exporter:latest
    container_name: pve-exporter
    restart: unless-stopped
    volumes:
      - ./prometheus/pve.yml:/etc/prometheus/pve.yml:ro
EOF

cat >> /opt/monitoring/prometheus/prometheus.yml <<'EOF'

  - job_name: pve
    metrics_path: /pve
    params:
      cluster: ['1']
      node: ['1']
    static_configs:
      - targets: ['192.168.1.2']
        labels:
          module: pve
    relabel_configs:
      - source_labels: [__address__]
        target_label: __param_target
      - source_labels: [module]
        target_label: __param_module
      - source_labels: [__param_target]
        target_label: instance
      - target_label: __address__
        replacement: pve-exporter:9221
EOF

cd /opt/monitoring && docker compose up -d
curl -s -X POST localhost:9090/-/reload && echo "reload OK"
module: must match the name in pve.yml. With a second host, add another - targets: entry with module: pve2.
B. TrueNAS: system and pool health
On TrueNAS, node_exporter runs as an app. It does not know about pool usage and health, so a small script writes them into a file, and node_exporter publishes that file.
B1. Folder and script (TrueNAS: System → Shell)
mkdir -p /mnt/tank/apps/node-exporter/textfile
chown -R 568:568 /mnt/tank/apps/node-exporter
chmod 755 /mnt/tank/apps/node-exporter /mnt/tank/apps/node-exporter/textfile

cat > /mnt/tank/apps/node-exporter/zpool-metrics.sh <<'EOF'
#!/bin/bash
# ZFS pool size, usage and health for node_exporter's textfile collector
DIR=/mnt/tank/apps/node-exporter/textfile
TMP=$(mktemp "$DIR/.zpool.XXXXXX")
zpool list -Hp -o name,size,alloc,free,cap,health | while read -r name size alloc free cap health; do
  echo "zpool_size_bytes{pool=\"$name\"} $size"
  echo "zpool_allocated_bytes{pool=\"$name\"} $alloc"
  echo "zpool_free_bytes{pool=\"$name\"} $free"
  echo "zpool_capacity_percent{pool=\"$name\"} ${cap%\%}"
  echo "zpool_healthy{pool=\"$name\",state=\"$health\"} $([ "$health" = ONLINE ] && echo 1 || echo 0)"
done | sort > "$TMP"
chmod 644 "$TMP" && mv "$TMP" "$DIR/zpool.prom"
EOF
bash /mnt/tank/apps/node-exporter/zpool-metrics.sh && cat /mnt/tank/apps/node-exporter/textfile/zpool.prom
The last line shows one block of lines per pool, including zpool_healthy{…,state="ONLINE"} 1.
Put the folder on a pool that's always available (your apps pool), not on a USB disk.
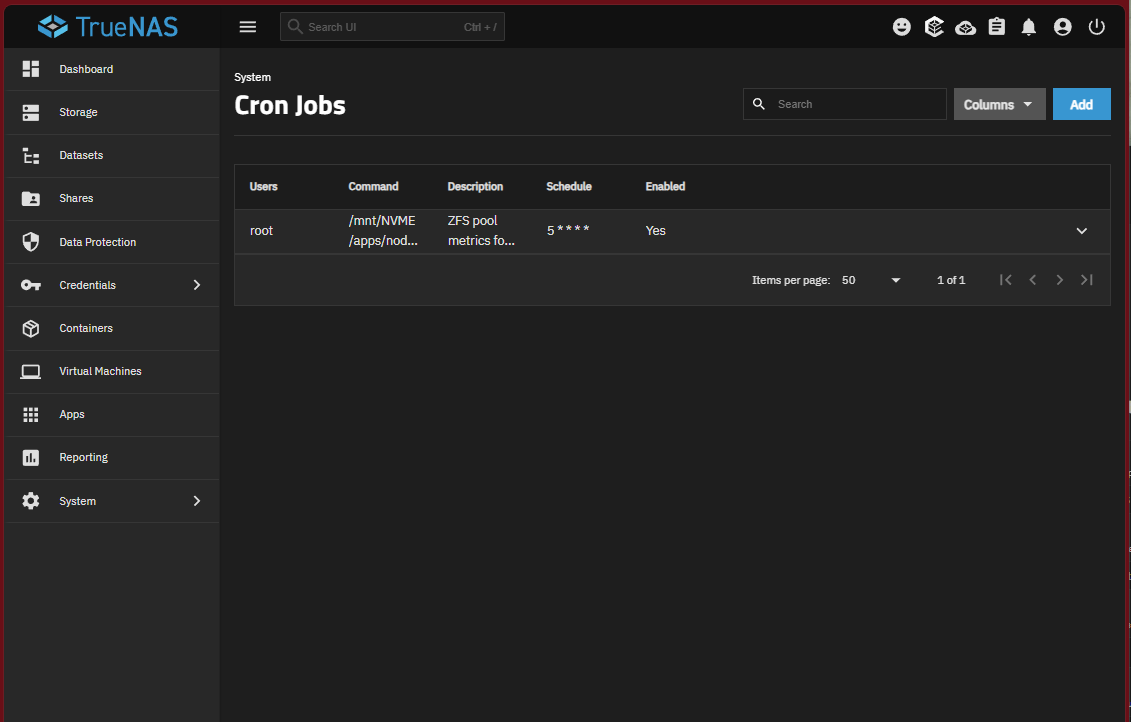
B2. Run the script every 5 minutes
System → Advanced Settings → Cron Jobs → Add:
| Field | Value |
|---|---|
| Description | ZFS pool metrics |
| Command | bash /mnt/tank/apps/node-exporter/zpool-metrics.sh |
| Run As User | root |
| Schedule | Custom: Minutes */5, all other fields * |
| Hide Standard Output / Error | ✅ ✅ |
B3. Install node_exporter as an app
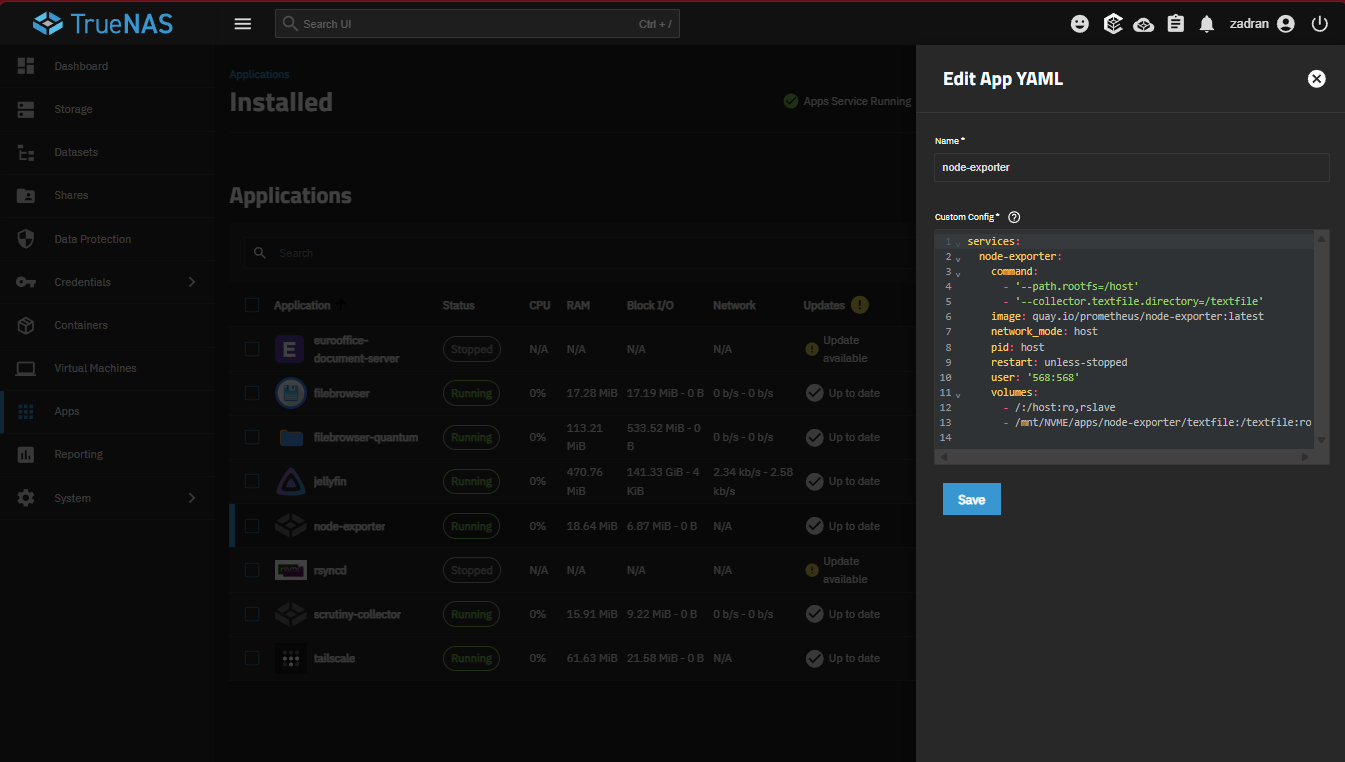
Apps → Discover Apps → ⋮ (top right) → Install via YAML. Name: node-exporter. Paste:
services:
  node-exporter:
    image: prom/node-exporter:latest
    restart: unless-stopped
    network_mode: host
    pid: host
    user: "568:568"
    command:
      - --path.rootfs=/host
      - --collector.textfile.directory=/textfile
    volumes:
      - /:/host:ro,rslave
- /mnt/tank/apps/node-exporter/textfile:/textfile:ro| Line | Why |
|---|---|
network_mode: host |
Publishes on the NAS's own IP, port 9100 |
pid: host, /:/host |
Lets the exporter see the real system, not just its container |
user: "568:568" |
The TrueNAS apps user. The default user, nobody, cannot read the textfile folder. |
Check from the monitoring container:
curl -s http://192.168.1.10:9100/metrics | grep '^zpool_'B4. Add the NAS to Prometheus
The NAS becomes a second target of the node job from Part 1. Open the file:
nano /opt/monitoring/prometheus/prometheus.ymlUnder job_name: node, add the NAS below the existing Proxmox target, with the same indentation:
      - targets: ['192.168.1.10:9100']
        labels:
          host: nas
Save, then reload:
curl -s -X POST localhost:9090/-/reload && echo "reload OK"C. UniFi: Wi-Fi and switches (Unpoller)
C1. A read-only account in UniFi
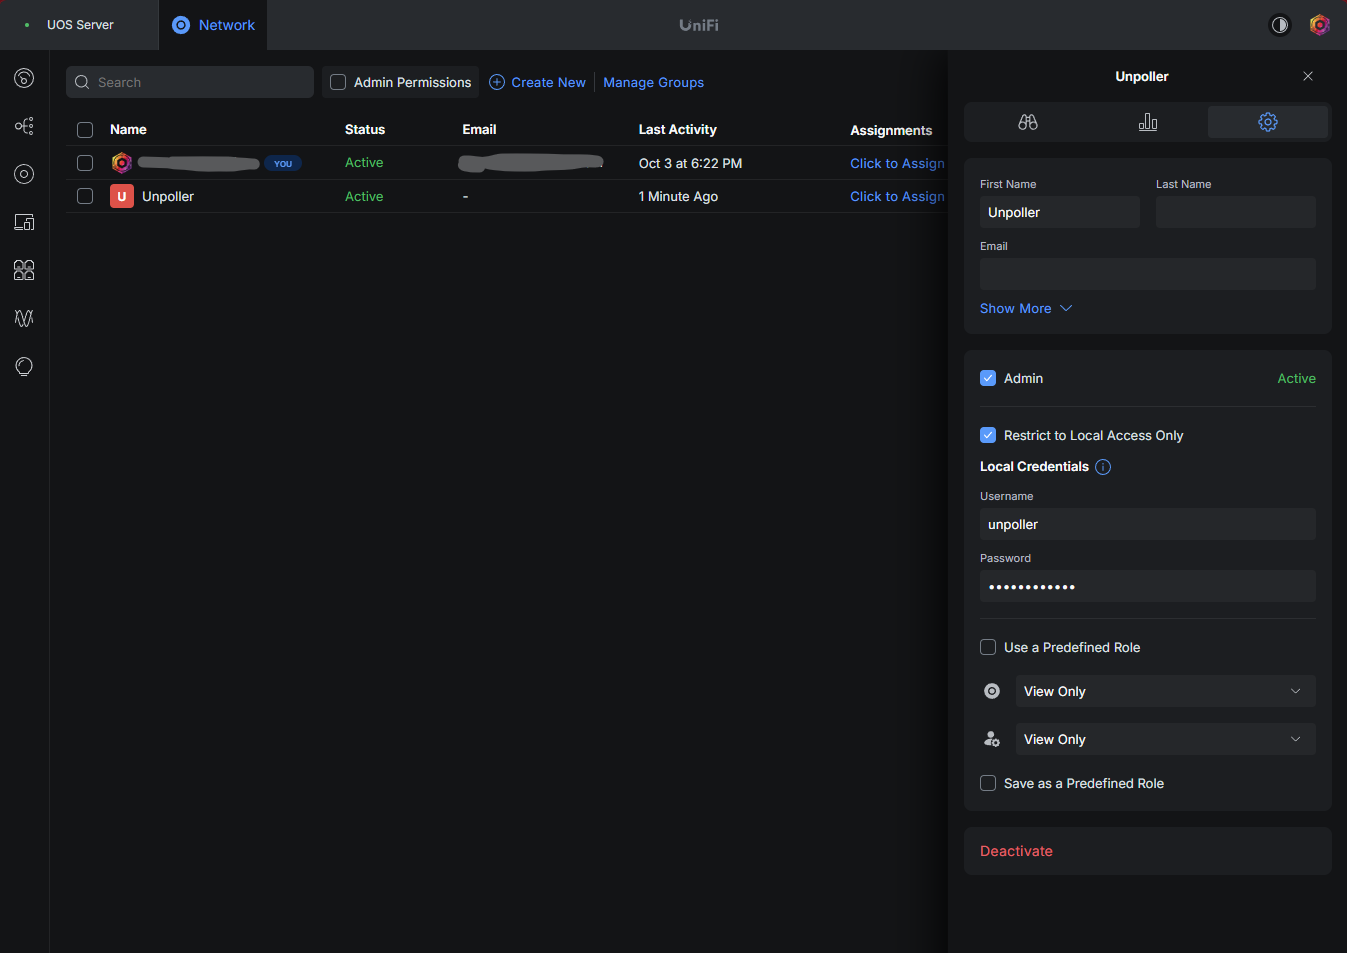
In the UniFi Network app: Settings → Admins & Users → Create New:
| Field | Value |
|---|---|
| Name / username | unpoller |
| Restrict to local access only | ✅ (no Ubiquiti cloud account) |
| Role | View Only for the Network app |
| Password | a long random one |
C2. Password, exporter and job (monitoring container)
Add the password to the .env file:
nano /opt/monitoring/.envAdd a second line, save:
UNPOLLER_PASSWORD=the-password-you-choseThen add to the override file and the job list. The controller address comes from Your values. For UniFi OS Server, use port 11443. For a UniFi gateway (UDM/UCG), use https:// and its IP.
cat >> /opt/monitoring/compose.override.yaml <<'EOF'

  unpoller:
    image: ghcr.io/unpoller/unpoller:latest
    container_name: unpoller
    restart: unless-stopped
    environment:
      - UP_UNIFI_DEFAULT_URL=https://192.168.1.15:11443
      - UP_UNIFI_DEFAULT_USER=unpoller
      - UP_UNIFI_DEFAULT_PASS=${UNPOLLER_PASSWORD}
      - UP_UNIFI_DEFAULT_VERIFY_SSL=false
      - UP_UNIFI_DEFAULT_SAVE_SITES=true
      - UP_UNIFI_DEFAULT_SAVE_DPI=false
      - UP_INFLUXDB_DISABLE=true
      - UP_PROMETHEUS_DISABLE=false
      - UP_PROMETHEUS_NAMESPACE=unpoller
EOF

cat >> /opt/monitoring/prometheus/prometheus.yml <<'EOF'

  - job_name: unpoller
    static_configs:
      - targets: ['unpoller:9130']
EOF

cd /opt/monitoring && docker compose up -d
curl -s -X POST localhost:9090/-/reload && echo "reload OK"
sleep 40
docker compose logs unpoller --since 1m | tail -5
The log should mention your site and devices, and no 401 or login failed.
Check: everything UP?
curl -s 'localhost:9090/api/v1/targets?state=active' |
  jq -r '.data.activeTargets[] | "\(.health)\t\(.labels.job)\t\(.labels.host // .labels.instance)"' | sort -k2 | column -t
Expected: one line per target, all up:
up  node        nas
up  node        pve
up  prometheus  localhost:9090
up  pve         192.168.1.2
up  unpoller    unpoller:9130
Beginner trap: in the Prometheus web UI you can type queries like
up{job="pve"}. Withcurlon the command line, the{ }confuses curl. Usecurl -G … --data-urlencode 'query=up{job="pve"}'as in this series, or theapi/v1/targetscall above.
In Part 3 these numbers become dashboards.
Troubleshooting
| Problem | Fix |
|---|---|
pve UP, but no VM data |
Token created without --privsep 0. Delete it (pveum user token remove prometheus@pve exporter) and create it again as in A1. |
pve DOWN, log says 401 |
Wrong token in pve.yml, or the module name doesn't match the job's module: label. |
No zpool_ lines from the NAS |
Run the script by hand (B1) and check ls -l /mnt/tank/apps/node-exporter/textfile. The file must be readable by everyone (-rw-r--r--). |
| Unpoller: login failed | Wrong password, or the account isn't local. Check C1. |
| Reload prints an error | A YAML indentation mistake in prometheus.yml. Every - job_name needs exactly 2 spaces in front. |
Did this guide work for you?
Thank you! That helps me keep this guide right.