Homelab monitoring, Part 1: Prometheus and Grafana on Proxmox
Set up Prometheus and Grafana in a small container on Proxmox to collect and show numbers from your homelab.
Before you start
- A Proxmox VE server, version 8 or 9.
- A free IP address in your network for the monitoring container.
- Fill in Your values below and every command on this page updates to match.
Your values
Fill these in and every command below updates to match. Nothing is sent anywhere.
Run this at your own risk. These steps worked on my hardware; yours may differ. Take a backup first, read each command before running it, and see the disclaimer.
You have a Proxmox server, maybe a NAS, and a few VMs and containers. But how busy is the CPU? How full are the disks? How hot does the server get? In this series you build a monitoring stack. It collects these numbers every 30 seconds, keeps them for months, shows them in clear dashboards, and sends an alert to your phone when something goes wrong.
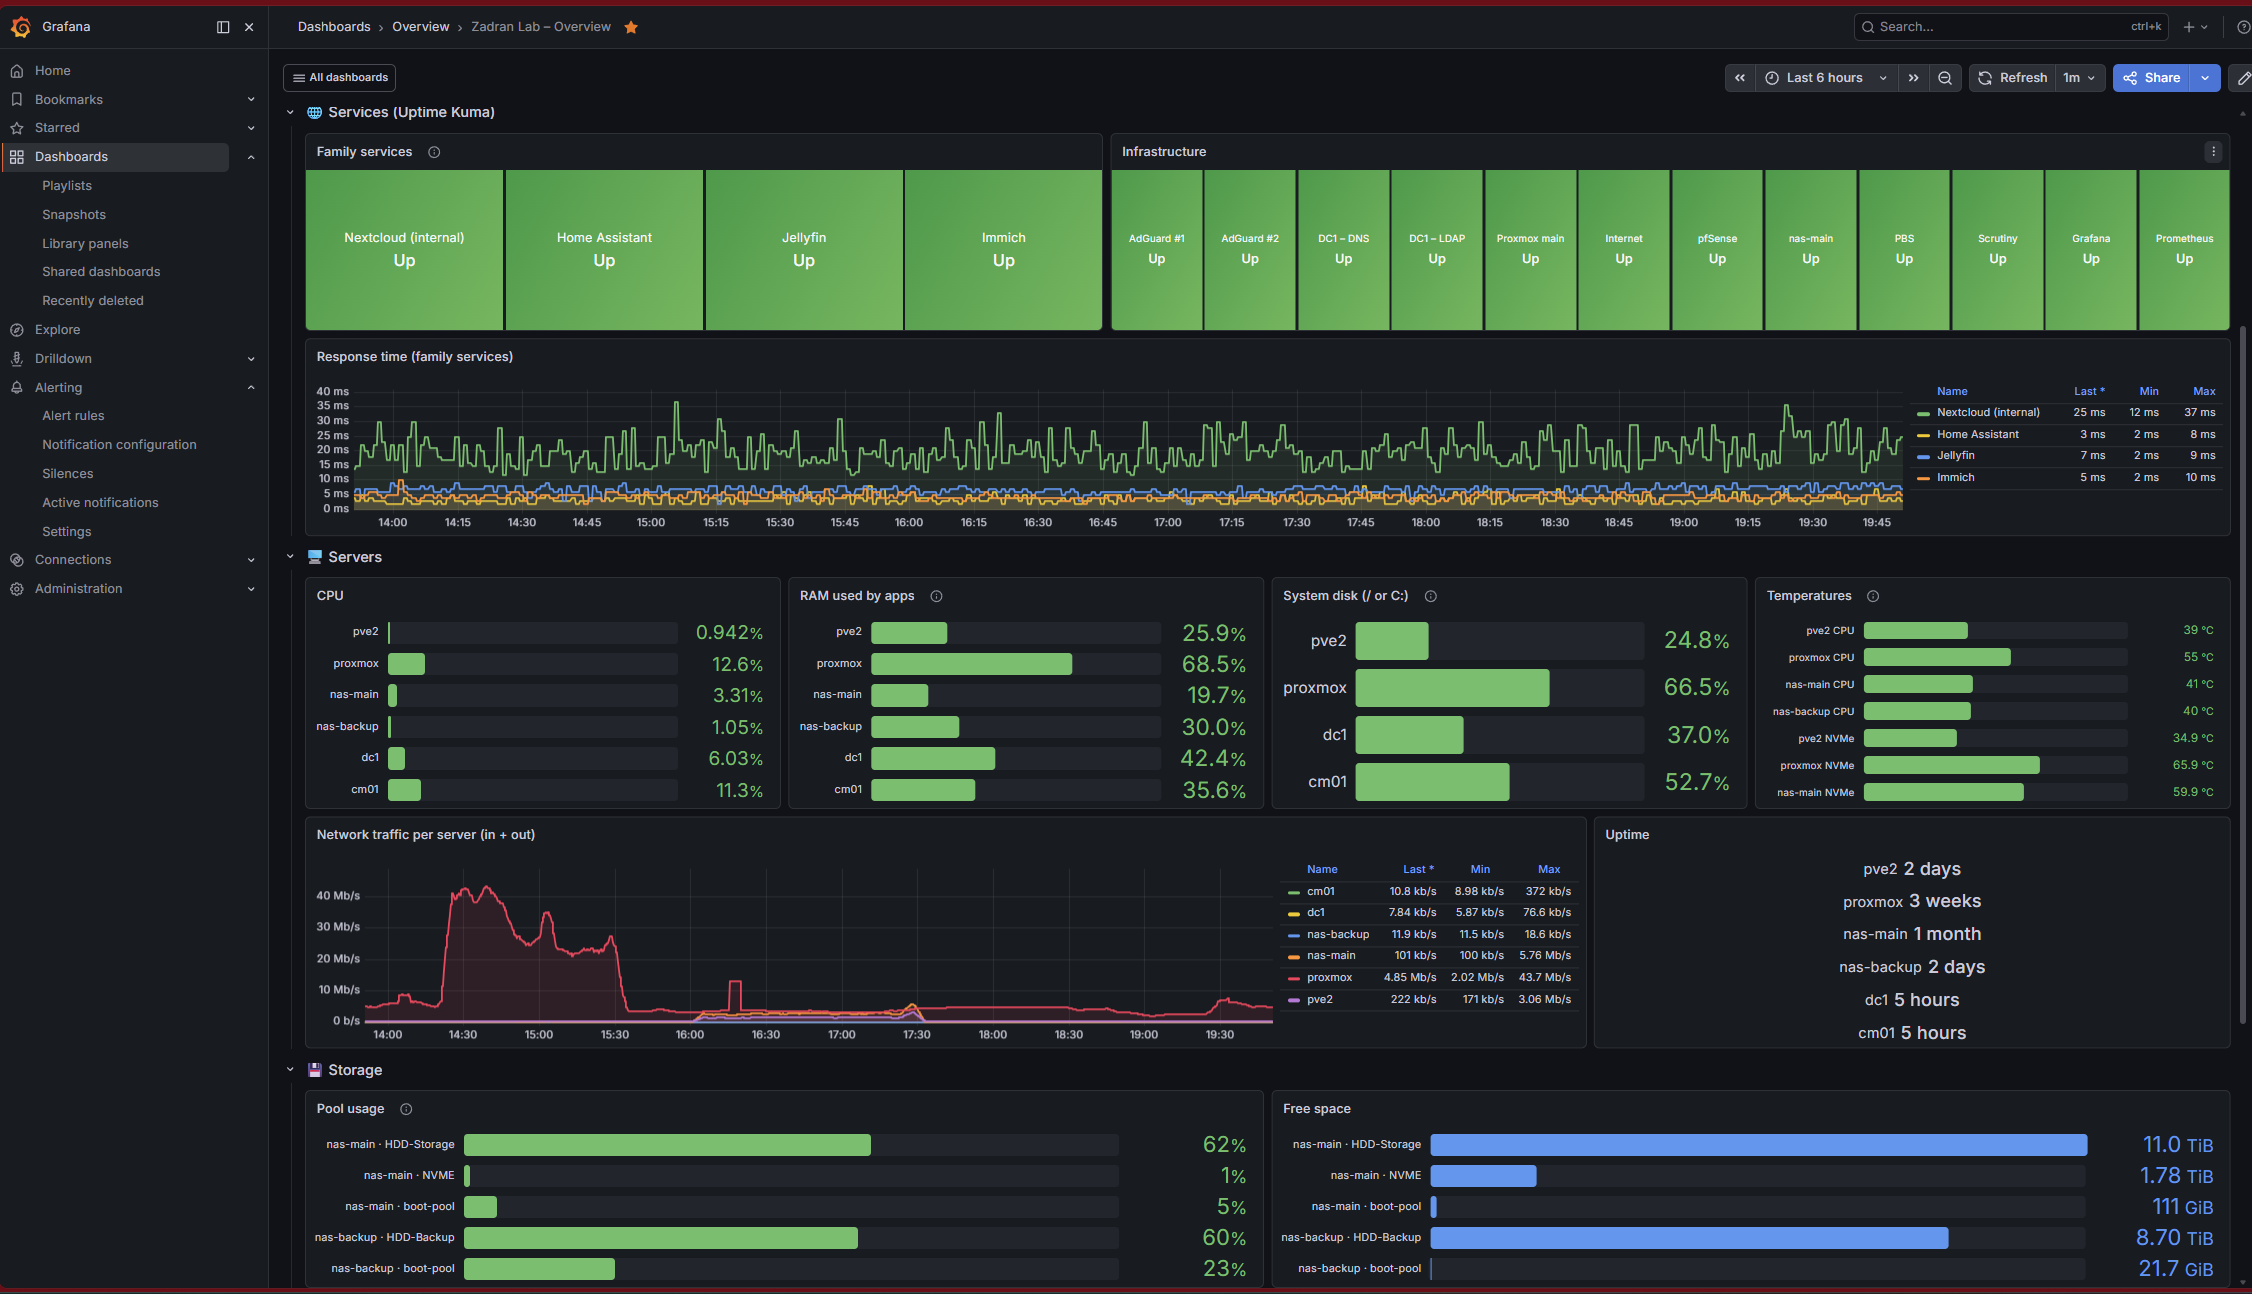
The series:
| Part | What you build |
|---|---|
| 1 (this one) | Prometheus + Grafana in a container, first data from the Proxmox host |
| 2 | More data: all VMs and containers, the NAS (TrueNAS), UniFi Wi-Fi |
| 3 | Ready-made dashboards, sorted into folders |
| 4 | Alerts to your phone with ntfy |
| 5 | Home Assistant, Windows servers, Uptime Kuma, and one script that rebuilds everything |
| 6 | Internet traffic from pfSense |
| 7 | Internet outages, ping and speed tests |
| 8 | Backup status from Proxmox Backup Server |
How it works
| Part | Job |
|---|---|
| Exporters | Small programs on each machine that publish numbers (CPU, RAM, disks…) on a web page |
| Prometheus | Visits every exporter every 30 seconds and stores the numbers |
| Grafana | Draws dashboards from Prometheus and sends alerts |
All of it runs in one small Linux container on Proxmox, with Docker inside.
Step 1: Create the container
Open the Shell of your Proxmox node (click the node name in the left tree → Shell) and paste:
pveam update
TPL=$(pveam available --section system | awk '/debian-13-standard.*_amd64/ {print $2}' | sort -V | tail -1)
echo "Downloading: $TPL"
pveam download local "$TPL"
The echo line must show a name ending in _amd64.tar.zst.
Beginner trap: Proxmox also lists ARM templates (
_arm64). They download without problems, but then the container will not start and shows "Exec format error". The command above only picksamd64.
Now create and start the container:
TPL=$(ls /var/lib/vz/template/cache/ | grep 'debian-13-standard.*_amd64' | sort -V | tail -1)

pct create 140 local:vztmpl/$TPL \
  --hostname monitoring \
  --cores 2 --memory 2048 --swap 512 \
  --rootfs local-lvm:20 \
  --net0 name=eth0,bridge=vmbr0,ip=192.168.1.40/24,gw=192.168.1.1 \
  --nameserver 192.168.1.1 \
  --unprivileged 1 --features nesting=1,keyctl=1 \
  --onboot 1

pct start 140
pct status 140
pct exec 140 -- passwdnesting=1,keyctl=1lets Docker run inside the container.- 20 GB of disk is enough for a year of data from a normal homelab.
pct statusmust saystatus: running. The last line sets the root password.
Step 2: Install Docker
pct exec 140 -- bash -c "apt update && apt full-upgrade -y && apt install -y curl jq ca-certificates && curl -fsSL https://get.docker.com | sh"
pct exec 140 -- docker version --format '{{.Server.Version}}'
The last line prints a version number.
Step 3: Write the configuration
Go into the container:
pct enter 140The prompt now starts with root@monitoring. Everything from here runs inside the container.
First, choose a Grafana admin password and save it in a file that only root can read. Use nano for this, not a hidden password prompt. When you paste into a hidden prompt, invisible characters can end up in the password.
mkdir -p /opt/monitoring
nano /opt/monitoring/.env
Type this line with your own password, then save with Ctrl + O, Enter, Ctrl + X:
GRAFANA_ADMIN_PASSWORD=choose-a-long-passwordchmod 600 /opt/monitoring/.envNow the three configuration files: the Docker setup, the Prometheus job list, and the Grafana data source.
mkdir -p /opt/monitoring/prometheus /opt/monitoring/grafana/provisioning/{datasources,dashboards,alerting,plugins}

cat > /opt/monitoring/compose.yaml <<'EOF'
services:
  prometheus:
    image: prom/prometheus:latest
    container_name: prometheus
    restart: unless-stopped
    command:
      - --config.file=/etc/prometheus/prometheus.yml
      - --storage.tsdb.path=/prometheus
      - --storage.tsdb.retention.time=365d
      - --web.enable-lifecycle
    ports:
      - "9090:9090"
    volumes:
      - ./prometheus:/etc/prometheus:ro
      - prometheus-data:/prometheus

  grafana:
    image: grafana/grafana-oss:latest
    container_name: grafana
    restart: unless-stopped
    ports:
      - "3000:3000"
    environment:
      - GF_SECURITY_ADMIN_PASSWORD=${GRAFANA_ADMIN_PASSWORD}
      - GF_USERS_ALLOW_SIGN_UP=false
      - GF_PLUGINS_PREINSTALL_DISABLED=true
      - TZ=Europe/Berlin
    volumes:
      - grafana-data:/var/lib/grafana
      - ./grafana/provisioning:/etc/grafana/provisioning:ro
    depends_on:
      - prometheus

volumes:
  prometheus-data:
  grafana-data:
EOF

cat > /opt/monitoring/prometheus/prometheus.yml <<'EOF'
global:
  scrape_interval: 30s
  evaluation_interval: 30s

scrape_configs:
  - job_name: prometheus
    static_configs:
      - targets: ['localhost:9090']

  - job_name: node
    static_configs:
      - targets: ['192.168.1.2:9100']
        labels:
          host: pve
EOF

cat > /opt/monitoring/grafana/provisioning/datasources/prometheus.yml <<'EOF'
apiVersion: 1
datasources:
  - name: Prometheus
    type: prometheus
    uid: prometheus
    access: proxy
    url: http://prometheus:9090
    isDefault: true
EOF
What the settings mean:
| Setting | Meaning |
|---|---|
retention.time=365d |
How long Prometheus keeps the data: 365d is one year, 730d two years. |
--web.enable-lifecycle |
Lets you reload the Prometheus config without a restart (used in Part 2) |
host: pve |
A readable name for the machine. Dashboards and alerts show this instead of the IP. |
uid: prometheus |
A fixed ID for the data source. The dashboards in Part 3 rely on it. |
Step 4: Start the stack
cd /opt/monitoring && docker compose up -d
sleep 20
docker ps --format '{{.Names}}  {{.Status}}'
Expected result:
grafana     Up 20 seconds
prometheus  Up 21 seconds
Beginner trap:
docker composeonly works inside/opt/monitoring. If you run it from somewhere else you get "no configuration file provided: not found". That's why every command in this series starts withcd /opt/monitoring.
Step 5: The exporter on the Proxmox host
Prometheus is ready, but the Proxmox host doesn't publish any numbers yet. Leave the container (exit) and run this in the Proxmox host shell:
apt update && apt install -y prometheus-node-exporter
systemctl enable --now prometheus-node-exporter
curl -s localhost:9100/metrics | grep -c '^node_'
The last line prints a number in the hundreds or thousands. Those are the measurements the host now publishes.
The Debian package is the simplest way. It gets security updates together with Proxmox and needs no extra setup.
Step 6: Check in Prometheus
Open http://192.168.1.40:9090 → Status → Target health. Both jobs (prometheus and node) must show UP.
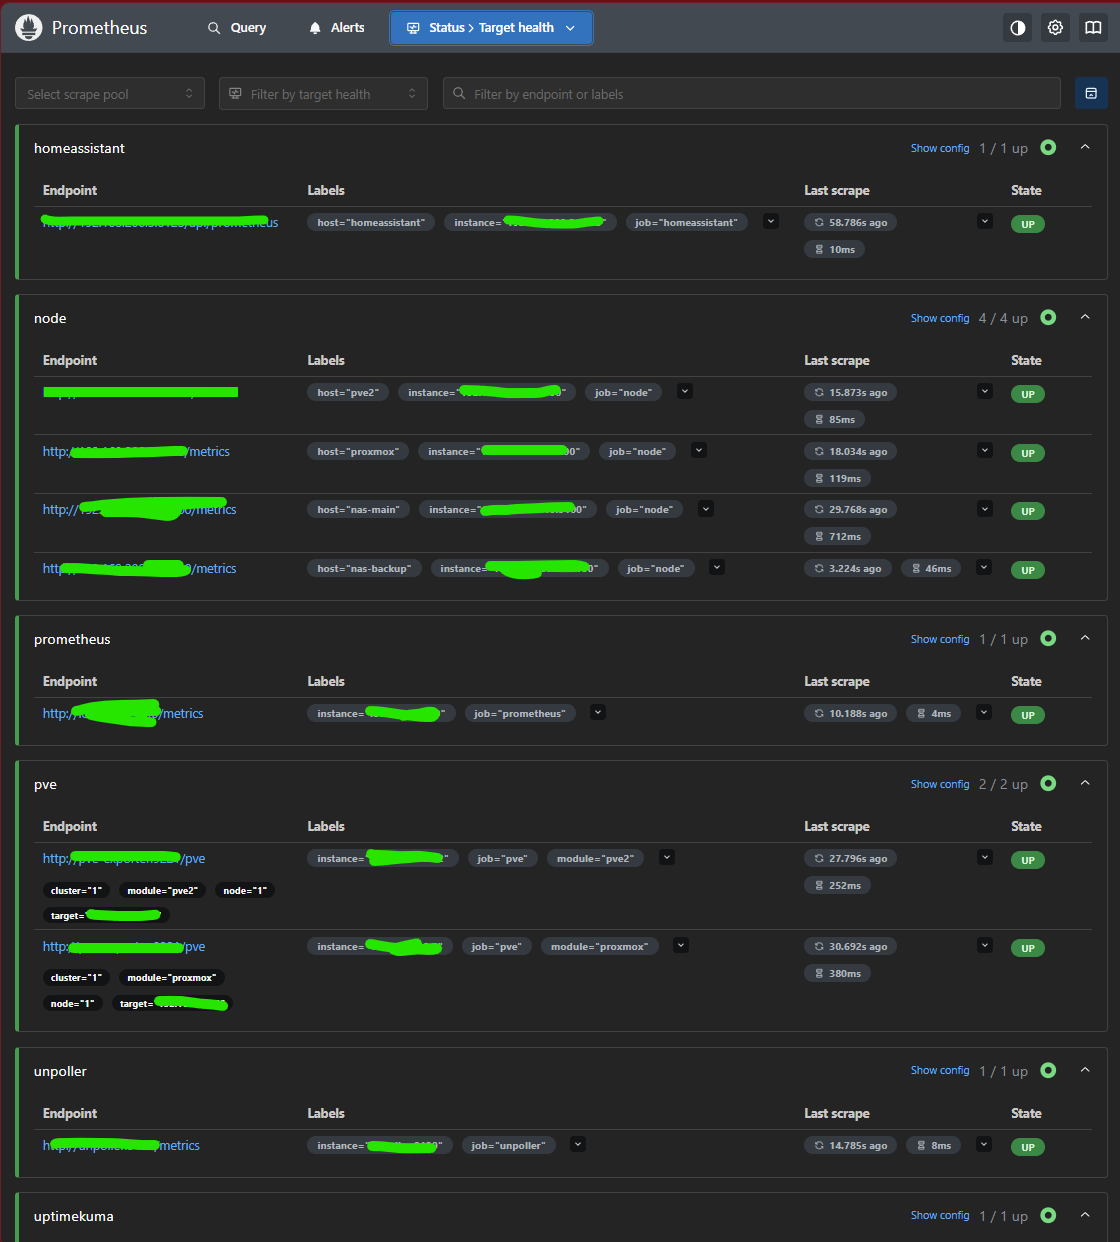
If node shows DOWN:
- "connection refused": the exporter isn't running on the host. Repeat Step 5.
- "context deadline exceeded": a firewall blocks port 9100. If you use the Proxmox firewall, allow TCP 9100 from
192.168.1.40.
Step 7: First look in Grafana
Open http://192.168.1.40:3000 and log in as admin with the password from your .env file.
To see that data is arriving: Explore (compass icon) → switch the query editor to Code → type:
100 - avg(rate(node_cpu_seconds_total{mode="idle"}[5m])) * 100Click Run query. You see the CPU usage of your Proxmox host in percent.
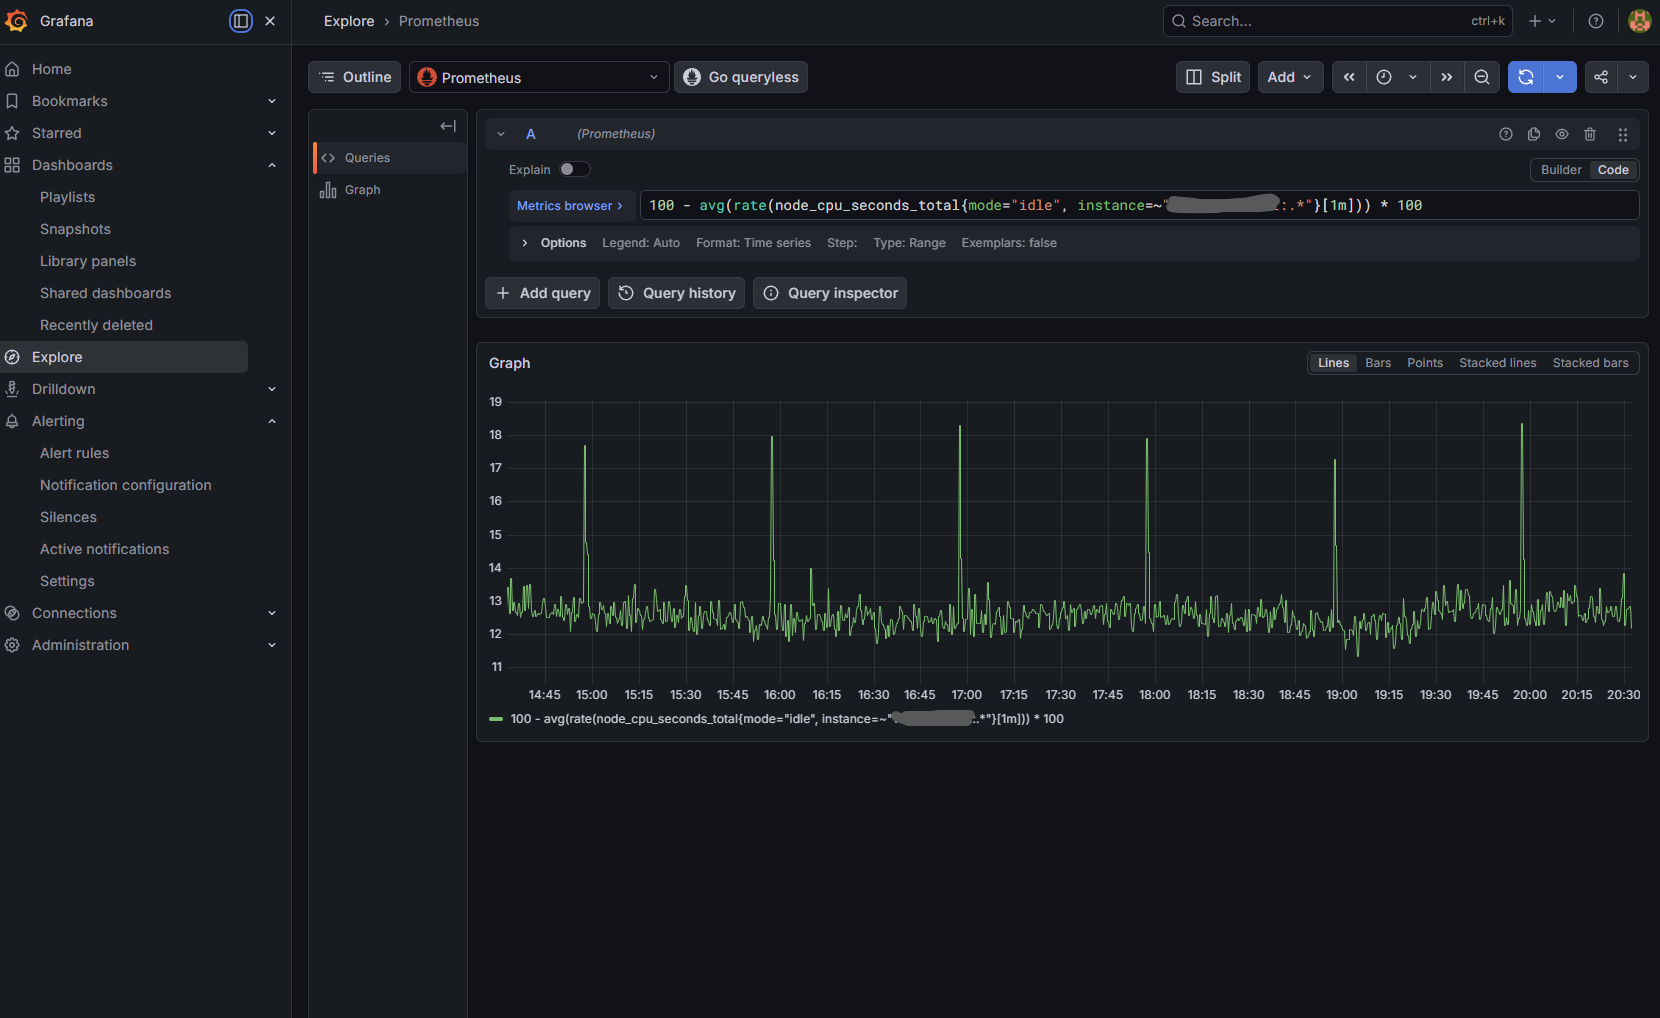
What you have now
- Prometheus collects data from your Proxmox host every 30 seconds and keeps it for a year.
- Grafana is connected and can draw it.
In Part 2 you add every VM and container, your NAS and your Wi-Fi.
Troubleshooting
| Problem | Fix |
|---|---|
| Container won't start: "Exec format error" | Wrong (ARM) template. Delete the container, repeat Step 1. |
| "no configuration file provided" | Run cd /opt/monitoring first. |
| Grafana login fails | Check the password in /opt/monitoring/.env. After changing it: cd /opt/monitoring && docker compose rm -sf grafana && docker volume rm monitoring_grafana-data && docker compose up -d. Only on a fresh install: this deletes Grafana's settings. |
Target node DOWN |
See Step 6. |
Did this guide work for you?
Thank you! That helps me keep this guide right.