Homelab monitoring, Part 4: Alerts to your phone
Free phone alerts with ntfy when a server stops, a disk gets hot or storage fills up, and again when it is fixed.
Before you start
- The monitoring stack from Part 1, ideally with the data sources from Part 2.
- An Android or iPhone with the ntfy app.
- Fill in Your values below and every command on this page updates to match.
Your values
Fill these in and every command below updates to match. Nothing is sent anywhere.
Run this at your own risk. These steps worked on my hardware; yours may differ. Take a backup first, read each command before running it, and see the disclaimer.
Dashboards are great, but nobody watches them all day. In this part Grafana starts watching for you and sends a push message to your phone when something is wrong, and another one when it's fixed.
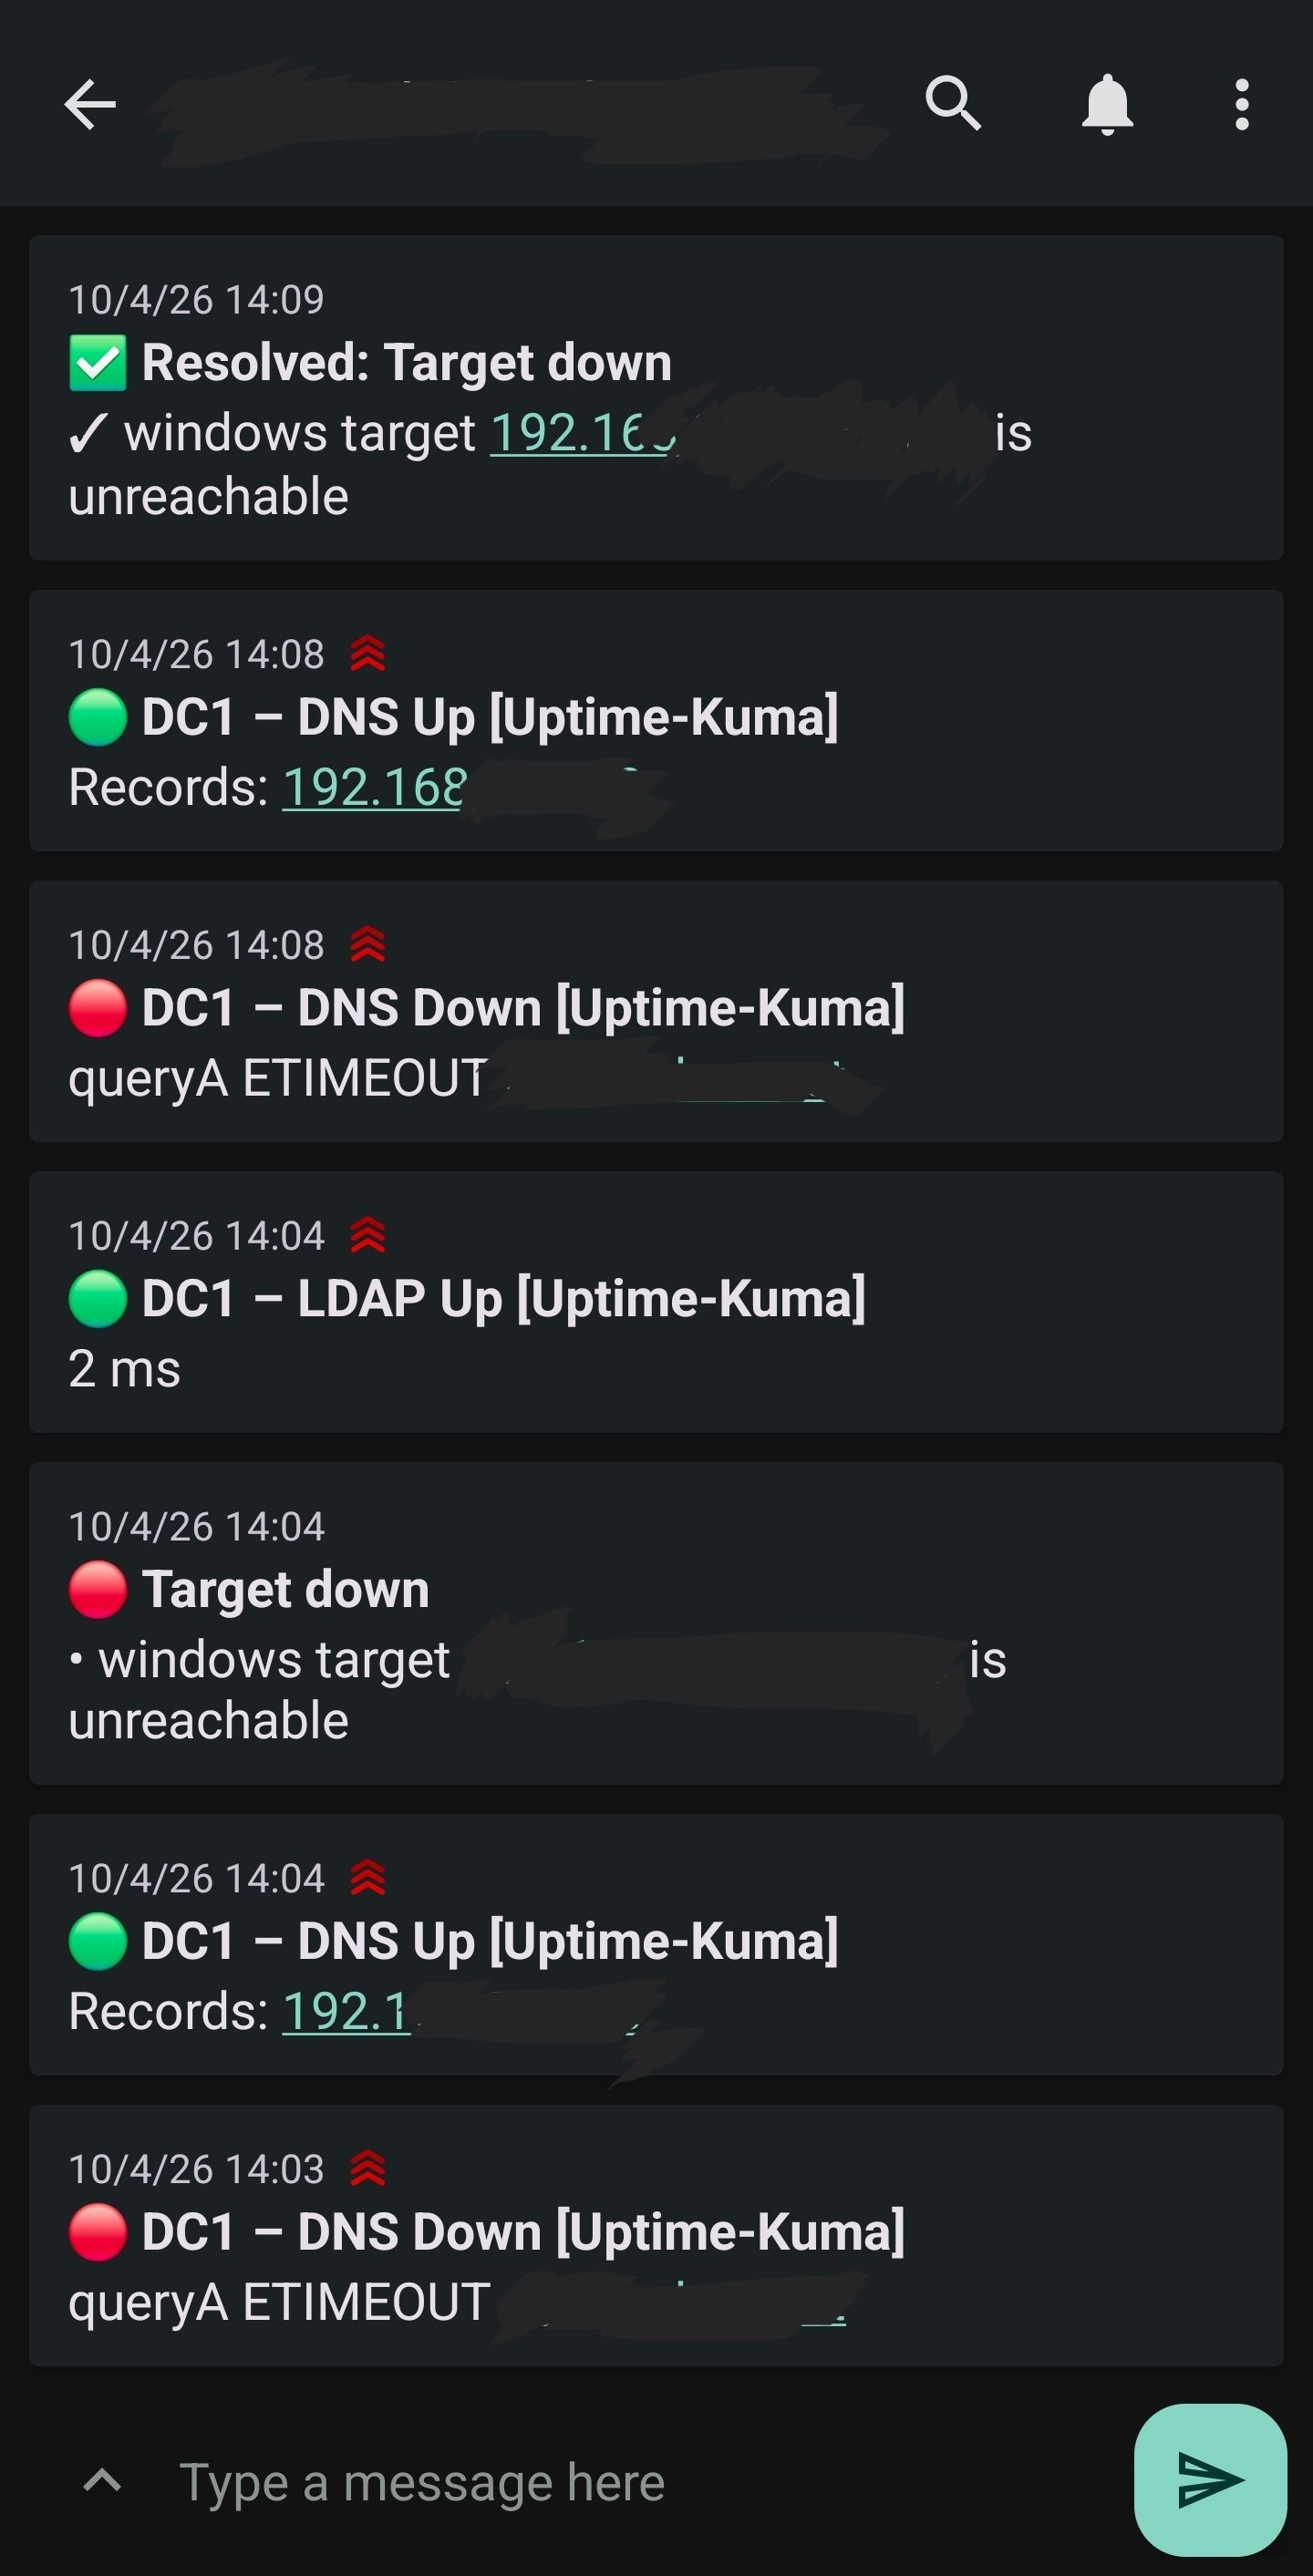
We use ntfy: a free push service, no account needed. If you followed the Uptime Kuma guide, you already have the app and a topic and can reuse them.
The alerts
| Alert | Fires when | Waits |
|---|---|---|
| Target down | An exporter doesn't answer (server off, crashed, network gone) | 3 min |
| ZFS pool above 80 % | A pool is getting full (ZFS slows down when full) | 10 min |
| ZFS pool not healthy | A pool is DEGRADED, FAULTED… (a disk has a problem) | 2 min |
| High CPU | A server is above 90 % CPU | 15 min |
| High RAM on Proxmox host | A Proxmox host is above 95 % RAM | 15 min |
| System disk above 85 % | The root disk (/) of a server is filling up |
10 min |
| Hardware too hot | A CPU core or NVMe drive is above 85 °C | 10 min |
| UniFi device offline | An access point or switch stops reporting | 3 min |
The "Waits" column stops false alarms. A value must stay bad for that long before you get a message.
Step 1: ntfy on your phone
Install the ntfy app (Play Store / App Store) and allow notifications.
Make up a secret topic name. Anyone who knows it can read your alerts, so make it random. On the monitoring container:
echo "myhome-alerts-$(openssl rand -hex 6)"Enter the result under Your values at the top of this page. Then, in the app: + → type the topic by hand → tick Instant delivery → Subscribe.
Test it from the monitoring container:
curl -H "Title: Monitoring test" -d "Hello from Grafana's container" ntfy.sh/myhome-alerts-3f9a1c2b7e4dA notification pops up on your phone within a few seconds.
Android: set Settings → Apps → ntfy → Battery → Unrestricted, otherwise messages arrive late.
Step 2: The alert file
Like the dashboards, the alerts live in a file. Grafana loads it at start.
Your ntfy topic and your Proxmox host name are filled in from Your values. With two Proxmox hosts, enter both names separated by | (for example pve|pve2).
cat > /opt/monitoring/grafana/provisioning/alerting/alerting.yaml <<'EOF'
apiVersion: 1

# ---------- Message format for ntfy ----------
templates:
  - orgId: 1
    name: ntfy
    template: |
      {{ define "ntfy.title" }}{{ if eq .Status "firing" }}🔴 {{ .CommonLabels.alertname }}{{ else }}✅ Resolved: {{ .CommonLabels.alertname }}{{ end }}{{ end }}
      {{ define "ntfy.message" }}{{ range .Alerts }}{{ if eq .Status "firing" }}• {{ else }}✓ {{ end }}{{ .Annotations.summary }}
      {{ end }}{{ end }}

# ---------- Where alerts go ----------
contactPoints:
  - orgId: 1
    name: ntfy-phone
    receivers:
      - uid: ntfy-phone
        type: webhook
        settings:
          url: "https://ntfy.sh/myhome-alerts-3f9a1c2b7e4d?tpl=yes&t=%7B%7B.title%7D%7D&m=%7B%7B.message%7D%7D"
          httpMethod: POST
          title: '{{ template "ntfy.title" . }}'
          message: '{{ template "ntfy.message" . }}'
        disableResolveMessage: false

# ---------- Send everything to the phone ----------
policies:
  - orgId: 1
    receiver: ntfy-phone
    group_by: ['alertname', 'grafana_folder']
    group_wait: 30s
    group_interval: 5m
    repeat_interval: 4h

# ---------- The alert rules ----------
groups:
  - orgId: 1
    name: homelab
    folder: Homelab Alerts
    interval: 1m
    rules:

      - uid: hl-target-down
        title: Target down
        condition: C
        for: 3m
        noDataState: OK
        execErrState: Error
        labels: {severity: critical}
        annotations:
          summary: '{{ $labels.job }} target {{ $labels.instance }} is unreachable'
        data:
          - refId: A
            relativeTimeRange: {from: 300, to: 0}
            datasourceUid: prometheus
            model: {refId: A, instant: true, expr: 'up'}
          - refId: C
            datasourceUid: __expr__
            model:
              refId: C
              type: threshold
              expression: A
              conditions: [{evaluator: {type: lt, params: [1]}}]

      - uid: hl-pool-full
        title: ZFS pool above 80%
        condition: C
        for: 10m
        noDataState: OK
        execErrState: Error
        labels: {severity: warning}
        annotations:
          summary: 'Pool {{ $labels.pool }} on {{ $labels.host }} is {{ printf "%.0f" $values.A.Value }}% full'
        data:
          - refId: A
            relativeTimeRange: {from: 600, to: 0}
            datasourceUid: prometheus
            model: {refId: A, instant: true, expr: 'zpool_capacity_percent'}
          - refId: C
            datasourceUid: __expr__
            model:
              refId: C
              type: threshold
              expression: A
              conditions: [{evaluator: {type: gt, params: [80]}}]

      - uid: hl-pool-unhealthy
        title: ZFS pool not healthy
        condition: C
        for: 2m
        noDataState: OK
        execErrState: Error
        labels: {severity: critical}
        annotations:
          summary: 'Pool {{ $labels.pool }} on {{ $labels.host }} is {{ $labels.state }}'
        data:
          - refId: A
            relativeTimeRange: {from: 600, to: 0}
            datasourceUid: prometheus
            model: {refId: A, instant: true, expr: 'zpool_healthy'}
          - refId: C
            datasourceUid: __expr__
            model:
              refId: C
              type: threshold
              expression: A
              conditions: [{evaluator: {type: lt, params: [1]}}]

      - uid: hl-cpu-high
        title: High CPU
        condition: C
        for: 15m
        noDataState: OK
        execErrState: Error
        labels: {severity: warning}
        annotations:
          summary: 'CPU on {{ $labels.host }} at {{ printf "%.0f" $values.A.Value }}% for 15 min'
        data:
          - refId: A
            relativeTimeRange: {from: 600, to: 0}
            datasourceUid: prometheus
            model: {refId: A, instant: true, expr: '100 - avg by (host) (rate(node_cpu_seconds_total{mode="idle"}[5m])) * 100'}
          - refId: C
            datasourceUid: __expr__
            model:
              refId: C
              type: threshold
              expression: A
              conditions: [{evaluator: {type: gt, params: [90]}}]

      - uid: hl-ram-high
        title: High RAM on Proxmox host
        condition: C
        for: 15m
        noDataState: OK
        execErrState: Error
        labels: {severity: warning}
        annotations:
          summary: 'RAM on {{ $labels.host }} at {{ printf "%.0f" $values.A.Value }}% for 15 min'
        data:
          - refId: A
            relativeTimeRange: {from: 600, to: 0}
            datasourceUid: prometheus
            model: {refId: A, instant: true, expr: '100 * (1 - node_memory_MemAvailable_bytes{host=~"pve"} / node_memory_MemTotal_bytes{host=~"pve"})'}
          - refId: C
            datasourceUid: __expr__
            model:
              refId: C
              type: threshold
              expression: A
              conditions: [{evaluator: {type: gt, params: [95]}}]

      - uid: hl-rootfs-full
        title: System disk above 85%
        condition: C
        for: 10m
        noDataState: OK
        execErrState: Error
        labels: {severity: warning}
        annotations:
          summary: 'System disk (/) on {{ $labels.host }} is {{ printf "%.0f" $values.A.Value }}% full'
        data:
          - refId: A
            relativeTimeRange: {from: 600, to: 0}
            datasourceUid: prometheus
            model: {refId: A, instant: true, expr: '100 * (1 - node_filesystem_avail_bytes{mountpoint="/", fstype!~"tmpfs|overlay"} / node_filesystem_size_bytes{mountpoint="/", fstype!~"tmpfs|overlay"})'}
          - refId: C
            datasourceUid: __expr__
            model:
              refId: C
              type: threshold
              expression: A
              conditions: [{evaluator: {type: gt, params: [85]}}]

      - uid: hl-temp-high
        title: Hardware too hot
        condition: C
        for: 10m
        noDataState: OK
        execErrState: Error
        labels: {severity: warning}
        annotations:
          summary: '{{ $labels.host }} {{ $labels.chip }} {{ $labels.sensor }} at {{ printf "%.0f" $values.A.Value }} °C'
        data:
          - refId: A
            relativeTimeRange: {from: 600, to: 0}
            datasourceUid: prometheus
            model: {refId: A, instant: true, expr: 'node_hwmon_temp_celsius{chip=~".*coretemp.*|nvme.*"}'}
          - refId: C
            datasourceUid: __expr__
            model:
              refId: C
              type: threshold
              expression: A
              conditions: [{evaluator: {type: gt, params: [85]}}]

      - uid: hl-unifi-offline
        title: UniFi device offline
        condition: C
        for: 3m
        noDataState: OK
        execErrState: Error
        labels: {severity: critical}
        annotations:
          summary: 'UniFi {{ $labels.type }} "{{ $labels.name }}" stopped reporting'
        data:
          - refId: A
            relativeTimeRange: {from: 600, to: 0}
            datasourceUid: prometheus
            model: {refId: A, instant: true, expr: 'changes(unpoller_device_uptime_seconds[5m])'}
          - refId: C
            datasourceUid: __expr__
            model:
              refId: C
              type: threshold
              expression: A
              conditions: [{evaluator: {type: lt, params: [1]}}]
EOF
cd /opt/monitoring && docker compose restart grafana
sleep 20
docker compose logs grafana --since 1m 2>&1 | grep -iE 'level=error.*(alert|provision)' || echo "no errors"
Expected result: no errors.
How the file is built:
| Section | Job |
|---|---|
templates |
Turns an alert into a short title (🔴 / ✅) and one line per problem |
contactPoints |
Sends it to ntfy. ntfy fills the title and message into the push message (tpl=yes). |
policies |
Everything goes to the phone. If a problem stays, it reminds you every 4 hours. |
groups |
The rules. Each has a query (A), a threshold (C) and a waiting time (for). |
Beginner trap 1: in this file a label is written
$labels.host, with one$. Some examples on the internet use$$labels. In this setup that breaks the templates, and your messages arrive as raw text like{{ $$labels.host }}.Beginner trap 2: the temperature rule only looks at CPU cores and NVMe drives. Many mainboards have sensor chips (for example nct6775) that report wrong values like 110 °C or −27 °C. If you watched all sensors, you would get alarms at night for nothing.
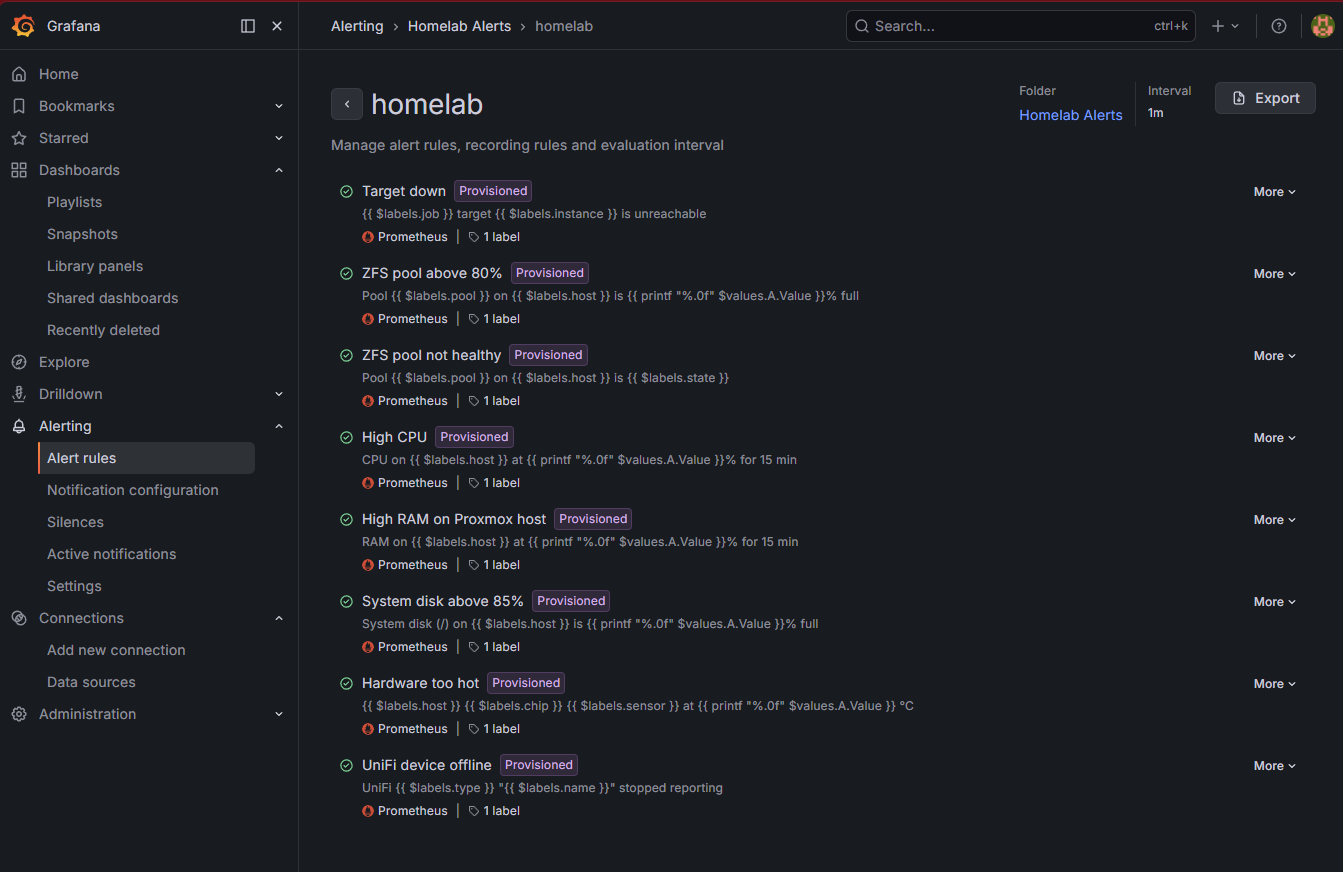
In Grafana: Alerting → Alert rules. The folder Homelab Alerts shows 8 rules, all Normal.
Step 3: Test it for real
Switch off an exporter for 4 minutes. In the Proxmox host shell:
systemctl stop prometheus-node-exporterAfter about 3–4 minutes your phone shows 🔴 Target down. Then:
systemctl start prometheus-node-exporterA few minutes later: ✅ Resolved: Target down.
Servers that are off on purpose
If a server is switched off regularly (for example a backup NAS that only runs at night), "Target down" would alert you every day. Exclude it by its host name. In the rule Target down, change the query from up to:
up{host!~"backup-nas"}Several hosts: up{host!~"backup-nas|test-pc"}. Save the file and restart Grafana as in Step 2.
Changing an alert
It works like the dashboards: edit the file, then cd /opt/monitoring && docker compose restart grafana. The browser shows the rules, but you cannot change them there, because they come from the file.
To pause alerts for maintenance, use Alerting → Silences → New silence in the browser. That works with provisioned rules too.
Troubleshooting
| Problem | Fix |
|---|---|
Message shows {{ $labels.host }} as text |
Two $ instead of one. In the file: sed -i 's/\$\$/$/g' /opt/monitoring/grafana/provisioning/alerting/alerting.yaml, then restart Grafana. |
| No message at all | Test ntfy with curl (Step 1). Check the topic in the url: line. Look at Alerting → Alert rules: is the rule Firing? |
| "Hardware too hot" with impossible values | Your board has another bogus sensor chip. Run curl -s localhost:9100/metrics | grep node_hwmon_chip_names on that server and tell the rule which chips to watch. |
| Alerts every day for one server | Use the "off on purpose" exclusion above. |
In Part 5: Home Assistant, Windows servers, Uptime Kuma, the overview dashboard, and rebuilding everything with one script.
Did this guide work for you?
Thank you! That helps me keep this guide right.