Homelab monitoring, Part 5: Home Assistant, Windows servers, Uptime Kuma, and a one-command rebuild
Add Home Assistant, your Windows servers and Uptime Kuma to Grafana, plus one script that rebuilds everything.
Before you start
- The monitoring stack from Parts 1 to 4.
- Any of: Home Assistant, Windows servers, Uptime Kuma. Each section stands on its own.
- Fill in Your values below and every command on this page updates to match.
Files for this guide
The commands below download these for you. Open one to read it, or import a dashboard by hand.
home-assistant.json— Grafana dashboard: Home Assistant climate, air and powerwindows-servers.json— Grafana dashboard: Windows servers (domain controller and SCCM)zadran-lab-overview.json— Grafana dashboard: lab overviewsetup-monitoring.sh— One-command rebuild script for the whole monitoring stacklab.env.example— Settings template for the rebuild script (save it as lab.env)
Your values
Fill these in and every command below updates to match. Nothing is sent anywhere.
Run this at your own risk. These steps worked on my hardware; yours may differ. Take a backup first, read each command before running it, and see the disclaimer.
In this part you connect three more sources and add the overview dashboard, which shows the whole homelab on one page. At the end you learn how to rebuild the complete stack with one script.
| Section | What you get |
|---|---|
| A. Home Assistant | Room temperatures, humidity, CO₂, power per smart plug, monthly energy |
| B. Windows servers | Domain controller and other servers: CPU, RAM, disks, and critical services |
| C. Uptime Kuma | The status of all your services as tiles in Grafana |
| D. Overview | One page for everything |
| E. Setup script | Rebuild everything from scratch in 5 minutes |
A. Home Assistant
Home Assistant has a built-in Prometheus integration. You switch it on, but only for sensors. No people, no phone locations, no presence. Monitoring data should never show where people are or when they are home.
A1. Enable the integration
In Home Assistant, open the file configuration.yaml. The easiest way is the File editor app (Settings → Apps → File editor). You can also use the Terminal app with nano /config/configuration.yaml. Add this at the very end:
prometheus:
  namespace: hass
  filter:
    include_domains:
      - sensor
      - binary_sensor
      - fan
      - switch
      - climate
    exclude_entity_globs:
      - "sensor.*geocoded*"
      - "sensor.*location*"
      - "sensor.*ssid*"
      - "sensor.*bssid*"
      - "sensor.*distance*"
      - "sensor.*direction*"
      - "sensor.*travel*"
      - "sensor.*activity*"
      - "sensor.*steps*"
Beginner trap: in the HA Terminal, the first characters of a paste sometimes get lost. A comment line then loses its
#, and Home Assistant starts in recovery mode ("while scanning a simple key … could not find expected ':'"). Before pasting, press Enter once. And always check before restarting.
In the HA Terminal:
ha core checkOnly if it ends with Command completed successfully: Settings → System → ⋮ → Restart Home Assistant.
A2. A token for Prometheus
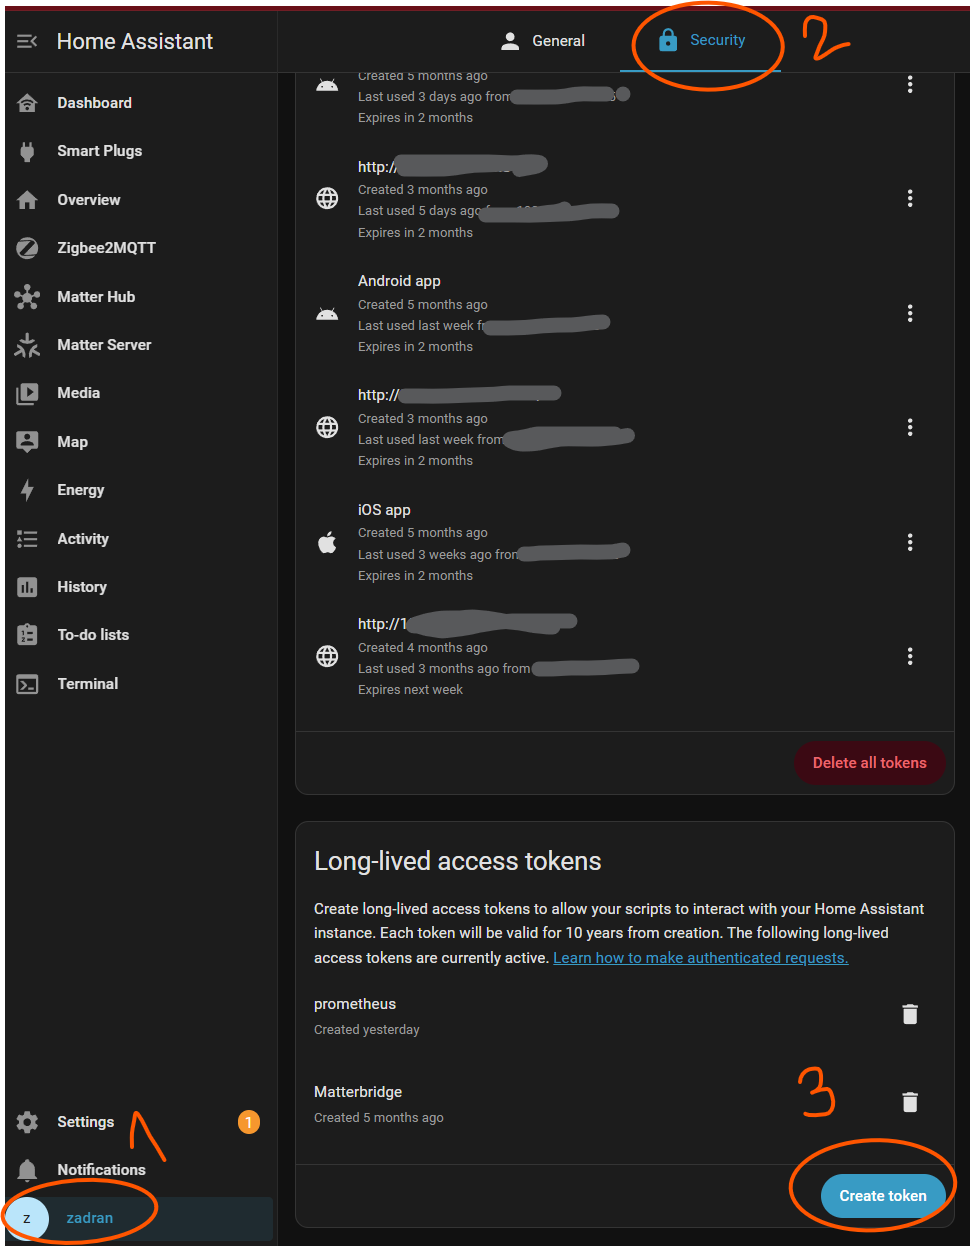
Your user name (bottom left) → Security → Long-lived access tokens → Create token, name prometheus. Copy it now, because it is shown only once.
On the monitoring container, save it with nano and remove invisible characters:
nano /opt/monitoring/prometheus/ha_tokenPaste the token, save. Then:
cd /opt/monitoring/prometheus
tr -cd 'A-Za-z0-9._-' < ha_token > ha_token.tmp && mv ha_token.tmp ha_token && chmod 644 ha_token
curl -s -o /dev/null -w '%{http_code}\n' -H "Authorization: Bearer $(cat ha_token)" http://192.168.1.20:8123/api/prometheus
It must print 200.
A3. The Prometheus job
cat >> /opt/monitoring/prometheus/prometheus.yml <<'EOF'

  - job_name: homeassistant
    scrape_interval: 60s
    metrics_path: /api/prometheus
    authorization:
      credentials_file: ha_token
    static_configs:
      - targets: ['192.168.1.20:8123']
        labels:
          host: homeassistant
    metric_relabel_configs:
      - source_labels: [entity]
        regex: 'sensor\.(my_phone|my_tablet)_.*'
        action: drop
EOF
curl -s -X POST localhost:9090/-/reload && echo "reload OK"
The metric_relabel_configs part is a second privacy filter. The HA companion app creates many sensors for each phone (battery, charging, Wi-Fi…). Put the start of your phones' entity IDs into the regex, and Prometheus deletes these sensors before it stores anything.
To see which sensors HA exports:
cd /opt/monitoring/prometheus
curl -s -H "Authorization: Bearer $(cat ha_token)" http://192.168.1.20:8123/api/prometheus |
  grep -o 'entity="[^"]*",friendly_name="[^"]*"' | sort -u
A4. The Home Assistant dashboard
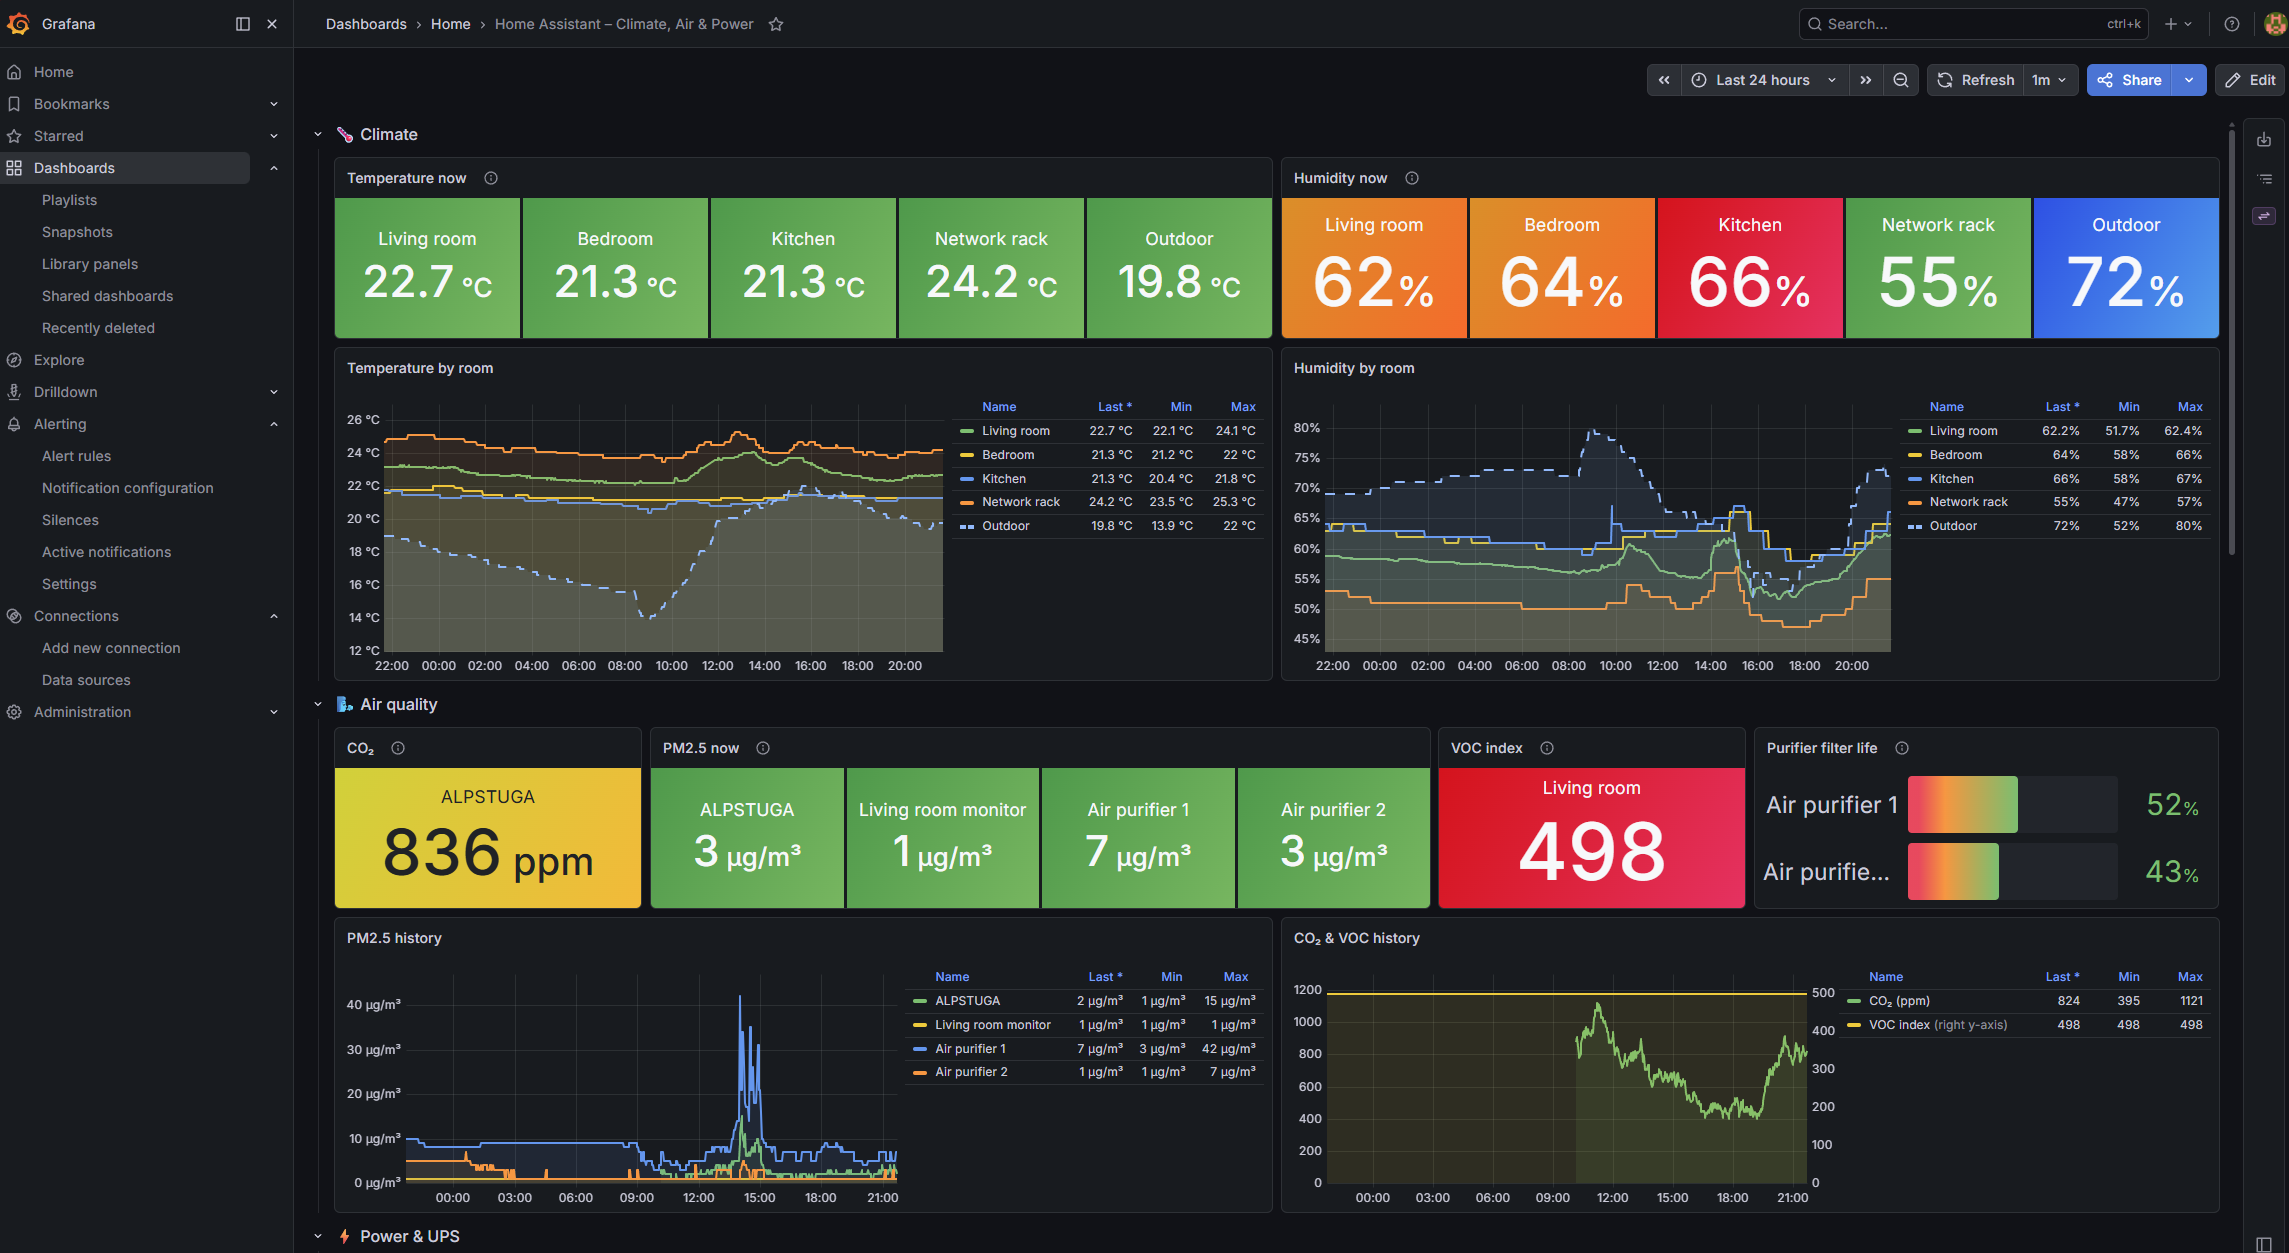
The dashboard Home Assistant – Climate, Air & Power shows climate per room, air quality, power per plug, monthly energy and battery levels.
mkdir -p /opt/monitoring/grafana/provisioning/dashboards/files/Home
curl -fsSL -o /opt/monitoring/grafana/provisioning/dashboards/files/Home/home-assistant.json \
  https://www.zadran.net/downloads/grafana/dashboards/home-assistant.json
This dashboard is an example from my home. It uses my entity IDs (for example
sensor.thermo_bedroom_temperature). Your sensors have other names. Open the file, search forsensor., and replace the IDs with yours from the list in A3. If a sensor does not exist, its panel just stays empty.
B. Windows servers
On Windows, windows_exporter does the job of node_exporter. The script below checks if the server is a domain controller, an SCCM server or a normal server. It picks the right services to watch and opens port 9182 only for the monitoring container.
B1. Install (PowerShell as administrator, on each Windows server)
The $monitor line is your monitoring container's IP, so the firewall only lets that one machine in:
$monitor = '192.168.1.40'
if (Get-Service NTDS -ErrorAction SilentlyContinue) {
    $role = 'Domain controller'
    $col  = 'cpu,memory,logical_disk,physical_disk,net,os,system,service,time,ad,dns,dfsr'
    $svc  = '(?i)^(ntds|dns|netlogon|kdc|w32time|dfsr)$'
} elseif (Get-Service SMS_EXECUTIVE -ErrorAction SilentlyContinue) {
    $role = 'SCCM'
    $col  = 'cpu,memory,logical_disk,physical_disk,net,os,system,service,time,mssql,iis'
    $svc  = '(?i)^(sms_executive|sms_site_component_manager|mssqlserver|sqlserveragent|w3svc|wsusservice|w32time)$'
} else {
    $role = 'Server'
    $col  = 'cpu,memory,logical_disk,physical_disk,net,os,system,service,time'
    $svc  = '(?i)^(w32time)$'
}
Write-Host "Detected role: $role" -ForegroundColor Cyan

New-Item -ItemType Directory -Force C:\ProgramData\windows_exporter | Out-Null
@"
collectors:
  enabled: $col
collector:
  service:
    include: "$svc"
log:
  level: warn
"@ | Set-Content -Encoding ascii C:\ProgramData\windows_exporter\config.yaml

[Net.ServicePointManager]::SecurityProtocol = 'Tls12'
$rel = Invoke-RestMethod https://api.github.com/repos/prometheus-community/windows_exporter/releases/latest
$url = ($rel.assets | Where-Object name -like '*-amd64.msi').browser_download_url
Invoke-WebRequest $url -OutFile "$env:TEMP\windows_exporter.msi" -UseBasicParsing
Start-Process msiexec.exe -Wait -ArgumentList "/i `"$env:TEMP\windows_exporter.msi`" /qn ADDLOCAL=FirewallException REMOTE_ADDR=$monitor CONFIG_FILE=`"C:\ProgramData\windows_exporter\config.yaml`""

Start-Sleep 5
Get-Service windows_exporter | Format-Table Name, Status, StartType
(Invoke-WebRequest http://localhost:9182/metrics -UseBasicParsing).Content -split "`n" |
    Select-String '^windows_service_state\{.*state="running"\} 1'
At the end you see the service Running and a list of the watched services.
B2. Job, dashboard and alerts (monitoring container)
cat >> /opt/monitoring/prometheus/prometheus.yml <<'EOF'

  - job_name: windows
    static_configs:
      - targets: ['192.168.1.21:9182']
        labels:
          host: dc1
EOF
curl -s -X POST localhost:9090/-/reload && echo "reload OK"

curl -fsSL -o /opt/monitoring/grafana/provisioning/dashboards/files/Servers/windows-servers.json \
  https://www.zadran.net/downloads/grafana/dashboards/windows-servers.json
More servers: add more - targets: entries with their own host: name.
The Windows alerts go into a second alert file:
| Alert | Fires when |
|---|---|
| Windows service stopped | A watched service with start type Automatic is stopped for 3 min |
| Windows disk above 85 % | A drive is above 85 % |
| Windows CPU high | CPU above 90 % for 15 min |
| Domain clock out of sync | The clock is off by more than 60 s (Kerberos fails at 5 min) |
| AD replication backlog | Pending AD replication for 30 min (with two or more DCs) |
| SCCM database log almost full | The CM_ database log is above 90 % |
cat > /opt/monitoring/grafana/provisioning/alerting/windows.yaml <<'EOF'
apiVersion: 1

# ---------- Windows servers (DC1, CM01) — uses contact point + policy from alerting.yaml ----------
groups:
  - orgId: 1
    name: windows
    folder: Homelab Alerts
    interval: 1m
    rules:

      - uid: win-service-stopped
        title: Windows service stopped
        condition: C
        for: 3m
        noDataState: OK
        execErrState: Error
        labels: {severity: critical}
        annotations:
          summary: '{{ $labels.name }} is stopped on {{ $labels.host }}'
        data:
          - refId: A
            relativeTimeRange: {from: 600, to: 0}
            datasourceUid: prometheus
            model: {refId: A, instant: true, expr: '(windows_service_state{state="running"} == bool 0) and on(instance, name) (windows_service_start_mode{start_mode="auto"} == 1)'}
          - refId: C
            datasourceUid: __expr__
            model:
              refId: C
              type: threshold
              expression: A
              conditions: [{evaluator: {type: gt, params: [0]}}]

      - uid: win-disk-full
        title: Windows disk above 85%
        condition: C
        for: 10m
        noDataState: OK
        execErrState: Error
        labels: {severity: warning}
        annotations:
          summary: 'Drive {{ $labels.volume }} on {{ $labels.host }} is {{ printf "%.0f" $values.A.Value }}% full'
        data:
          - refId: A
            relativeTimeRange: {from: 600, to: 0}
            datasourceUid: prometheus
            model: {refId: A, instant: true, expr: '100 * (1 - windows_logical_disk_free_bytes{volume=~"[A-Z]:"} / windows_logical_disk_size_bytes{volume=~"[A-Z]:"})'}
          - refId: C
            datasourceUid: __expr__
            model:
              refId: C
              type: threshold
              expression: A
              conditions: [{evaluator: {type: gt, params: [85]}}]

      - uid: win-cpu-high
        title: Windows CPU high
        condition: C
        for: 15m
        noDataState: OK
        execErrState: Error
        labels: {severity: warning}
        annotations:
          summary: 'CPU on {{ $labels.host }} at {{ printf "%.0f" $values.A.Value }}% for 15 min'
        data:
          - refId: A
            relativeTimeRange: {from: 600, to: 0}
            datasourceUid: prometheus
            model: {refId: A, instant: true, expr: '100 - avg by (host) (rate(windows_cpu_time_total{mode="idle"}[5m])) * 100'}
          - refId: C
            datasourceUid: __expr__
            model:
              refId: C
              type: threshold
              expression: A
              conditions: [{evaluator: {type: gt, params: [90]}}]

      - uid: win-time-drift
        title: Domain clock out of sync
        condition: C
        for: 10m
        noDataState: OK
        execErrState: Error
        labels: {severity: critical}
        annotations:
          summary: 'Clock on {{ $labels.host }} is {{ printf "%.0f" $values.A.Value }} s off. Kerberos logons fail above 5 min'
        data:
          - refId: A
            relativeTimeRange: {from: 600, to: 0}
            datasourceUid: prometheus
            model: {refId: A, instant: true, expr: 'abs(windows_time_computed_time_offset_seconds)'}
          - refId: C
            datasourceUid: __expr__
            model:
              refId: C
              type: threshold
              expression: A
              conditions: [{evaluator: {type: gt, params: [60]}}]

      - uid: win-ad-replication
        title: AD replication backlog
        condition: C
        for: 30m
        noDataState: OK
        execErrState: Error
        labels: {severity: warning}
        annotations:
          summary: '{{ $labels.host }} has {{ printf "%.0f" $values.A.Value }} pending AD replication syncs for 30 min'
        data:
          - refId: A
            relativeTimeRange: {from: 600, to: 0}
            datasourceUid: prometheus
            model: {refId: A, instant: true, expr: 'sum by (host) (windows_ad_replication_pending_synchronizations)'}
          - refId: C
            datasourceUid: __expr__
            model:
              refId: C
              type: threshold
              expression: A
              conditions: [{evaluator: {type: gt, params: [0]}}]

      - uid: win-sql-log-full
        title: SCCM database log almost full
        condition: C
        for: 15m
        noDataState: OK
        execErrState: Error
        labels: {severity: warning}
        annotations:
          summary: 'SQL log of {{ $labels.database }} on {{ $labels.host }} is {{ printf "%.0f" $values.A.Value }}% used'
        data:
          - refId: A
            relativeTimeRange: {from: 600, to: 0}
            datasourceUid: prometheus
            model: {refId: A, instant: true, expr: 'max by (host, database) (windows_mssql_databases_log_used_percent{database=~"CM_.*"})'}
          - refId: C
            datasourceUid: __expr__
            model:
              refId: C
              type: threshold
              expression: A
              conditions: [{evaluator: {type: gt, params: [90]}}]
EOF
cd /opt/monitoring && docker compose restart grafana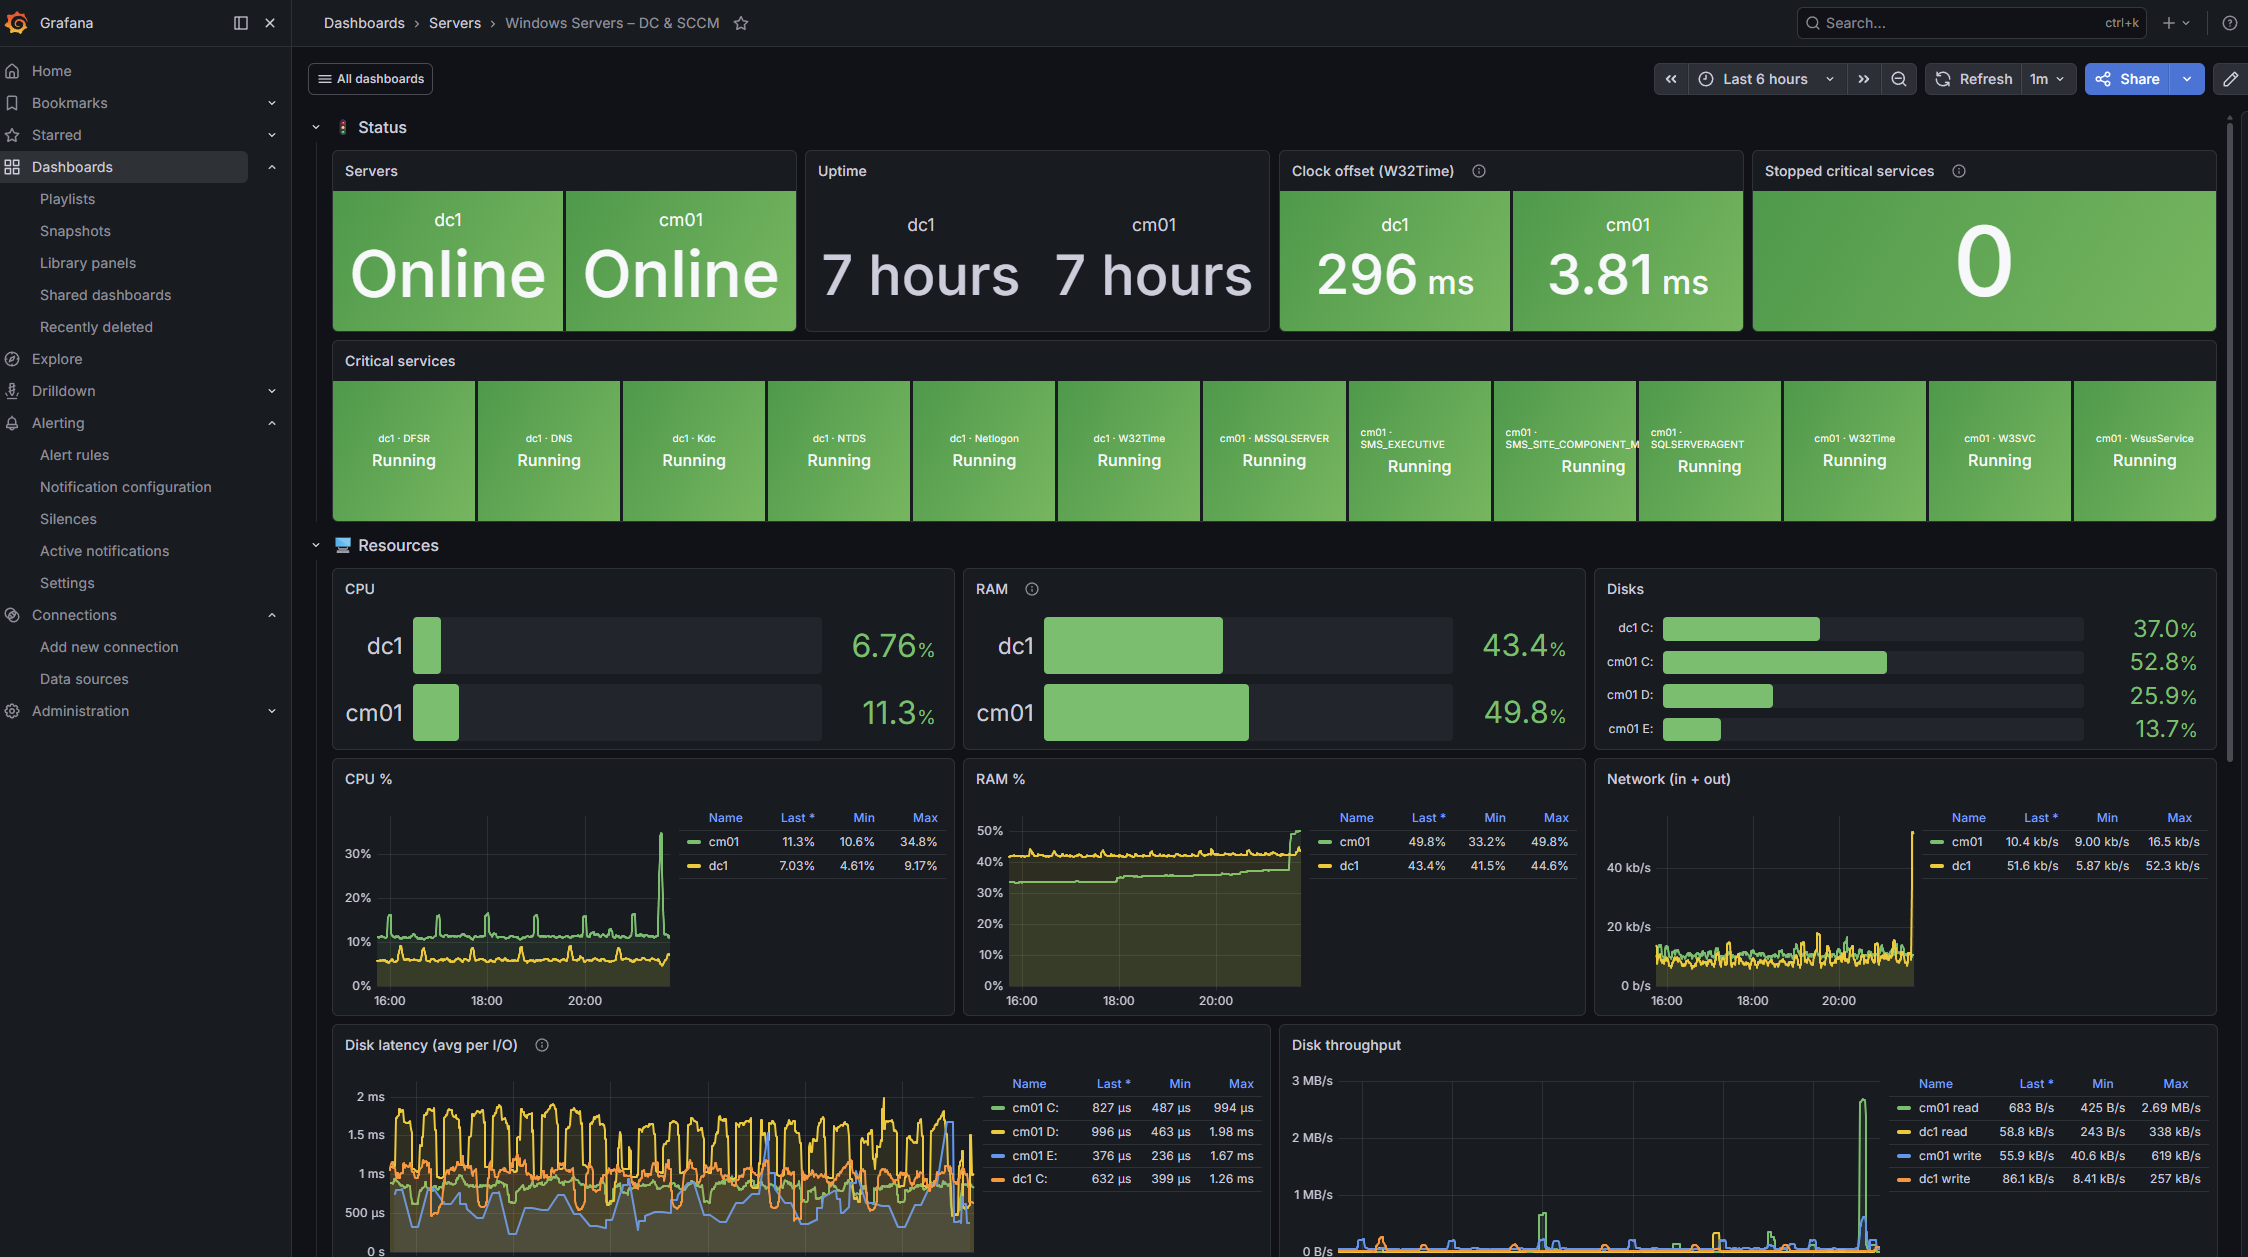
Test: stop the service W32Time on the server for 4 minutes. Your phone gets "w32time is stopped on dc1", and after starting it again, Resolved.
C. Uptime Kuma
If you followed the Uptime Kuma guide, Grafana can show all your monitors as tiles.
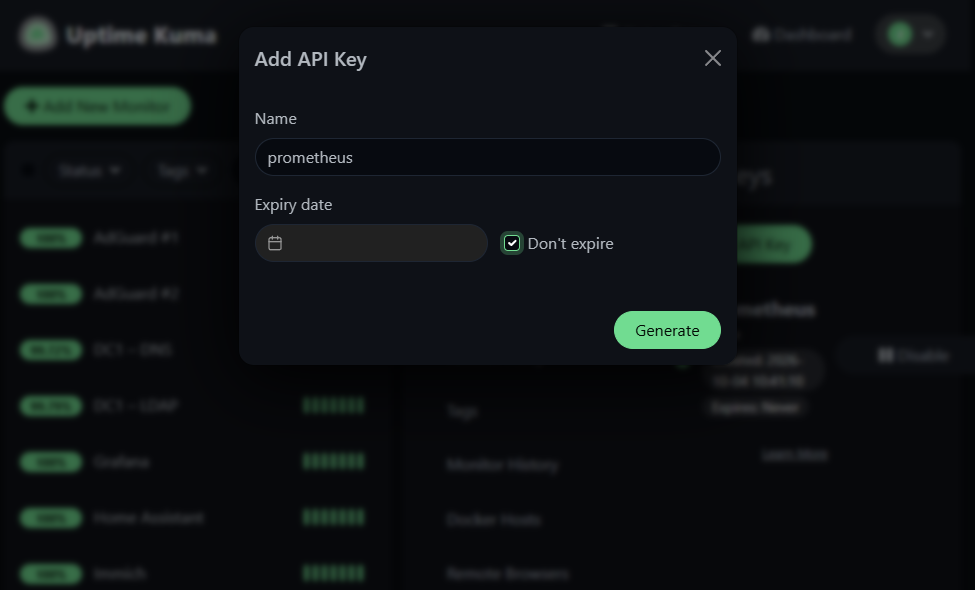
- In Uptime Kuma: Settings → API Keys → Add API Key, name
prometheus, Don't expire → Generate. Copy the key (starts withuk1_).
- On the monitoring container:
nano /opt/monitoring/prometheus/kuma_key        # paste the key, save
cd /opt/monitoring/prometheus
tr -cd 'A-Za-z0-9_' < kuma_key > kuma_key.tmp && mv kuma_key.tmp kuma_key && chmod 644 kuma_key
curl -s -o /dev/null -w '%{http_code}\n' -u "prometheus:$(cat kuma_key)" http://192.168.1.50/metrics

cat >> /opt/monitoring/prometheus/prometheus.yml <<'EOF'

  - job_name: uptimekuma
    scrape_interval: 60s
    basic_auth:
      username: prometheus
      password_file: kuma_key
    static_configs:
      - targets: ['192.168.1.50:80']
        labels:
          host: uptime
EOF
curl -s -X POST localhost:9090/-/reload && echo "reload OK"
The curl check must print 200. Uptime Kuma keeps sending its own alerts, so Grafana doesn't need extra rules for these monitors.
D. The overview dashboard
One page for the whole homelab: active alerts, all servers online/offline, CPU, RAM, disks, temperatures, pools, Wi-Fi clients, service status and home climate.
mkdir -p /opt/monitoring/grafana/provisioning/dashboards/files/Overview
curl -fsSL -o /opt/monitoring/grafana/provisioning/dashboards/files/Overview/zadran-lab-overview.json \
  https://www.zadran.net/downloads/grafana/dashboards/zadran-lab-overview.json
Make it your start page: open it, click the ☆ star, then Profile → Preferences → Home Dashboard → choose it → Save.
The Home row at the bottom uses my Home Assistant entity IDs, like the dashboard in A4. Adapt them the same way, or delete that row.
E. Rebuild everything with one script
Everything from Parts 1 to 5 is also available as one script. It reads your settings from a file called lab.env and builds the complete stack: Docker, all configuration files, all exporters, dashboards in folders, and alerts. Use it for a fresh install, or to rebuild after a broken container.
- Create the container and enter it as in Part 1, Steps 1 and 2.
- Download the script and the settings template:
mkdir -p /root/monitoring-setup && cd /root/monitoring-setup
curl -fsSLO https://www.zadran.net/downloads/grafana/setup-monitoring.sh
curl -fsSL -o lab.env https://www.zadran.net/downloads/grafana/lab.env.example
chmod 600 lab.env
nano lab.env- Fill in
lab.env: your IPs, passwords and tokens. Leave a section empty to skip it (for example if you have no UniFi). SetDASH_SOURCEtohttps://www.zadran.net/downloads/grafana/dashboards. - Optional dry run, which only writes files into a test folder:
sed 's#^STACK_DIR=.*#STACK_DIR="/tmp/monitoring-test"#' lab.env > lab-test.env
ENV_FILE=lab-test.env SKIP_DOCKER=1 bash setup-monitoring.sh- The real run:
bash setup-monitoring.shAt the end, the script prints all targets (UP/DOWN) and all dashboards with their folders.
You can run it again safely. It writes the configuration again, keeps your collected data (Docker volumes), and saves a backup of the old folder to /opt/monitoring.bak-<date>.
Keep
lab.envsafe and private. It contains all your passwords and tokens. Store a copy somewhere secure (for example in your password manager or on an encrypted NAS share), never in a public place.
That's it
Your homelab now has:
- data from every server, VM, NAS, access point, sensor and service
- dashboards in folders, as files
- alerts on your phone, with "Resolved" messages
- a script that rebuilds everything in minutes
Troubleshooting
| Problem | Fix |
|---|---|
| HA in recovery mode after the change | A broken line in configuration.yaml. The error names the line number; fix it, run ha core check, restart. |
| HA target: 401 | Token wrong or has invisible characters. Repeat A2 including the tr line. |
| Windows target DOWN | Firewall: the rule allows only the IP in $monitor. Check with Get-NetFirewallRule -DisplayName '*windows_exporter*' | Get-NetFirewallAddressFilter. |
| "Windows service stopped" for a service that's meant to be off | The alert only covers services set to Automatic. Set that service to Manual or Disabled in services.msc. |
| Uptime Kuma: 401 | Wrong API key. Generate a new one. |
| Script stops with "… is empty in lab.env" | A required value is missing. The message names it. |
Did this guide work for you?
Thank you! That helps me keep this guide right.