Homelab monitoring, Part 6: Internet traffic with pfSense
See your internet traffic per day and month from pfSense, import your old history, and keep two years of data.
Before you start
- The monitoring stack from Parts 1 to 4.
- pfSense CE 2.7 or newer, or pfSense Plus, as your router.
- Fill in Your values below and every command on this page updates to match.
Files for this guide
The commands below download these for you. Open one to read it, or import a dashboard by hand.
internet-pfsense.json— Grafana dashboard: internet traffic from pfSensevnstat2prom.py— vnStat to Prometheus converter
Your values
Fill these in and every command below updates to match. Nothing is sent anywhere.
Run this at your own risk. These steps worked on my hardware; yours may differ. Take a backup first, read each command before running it, and see the disclaimer.
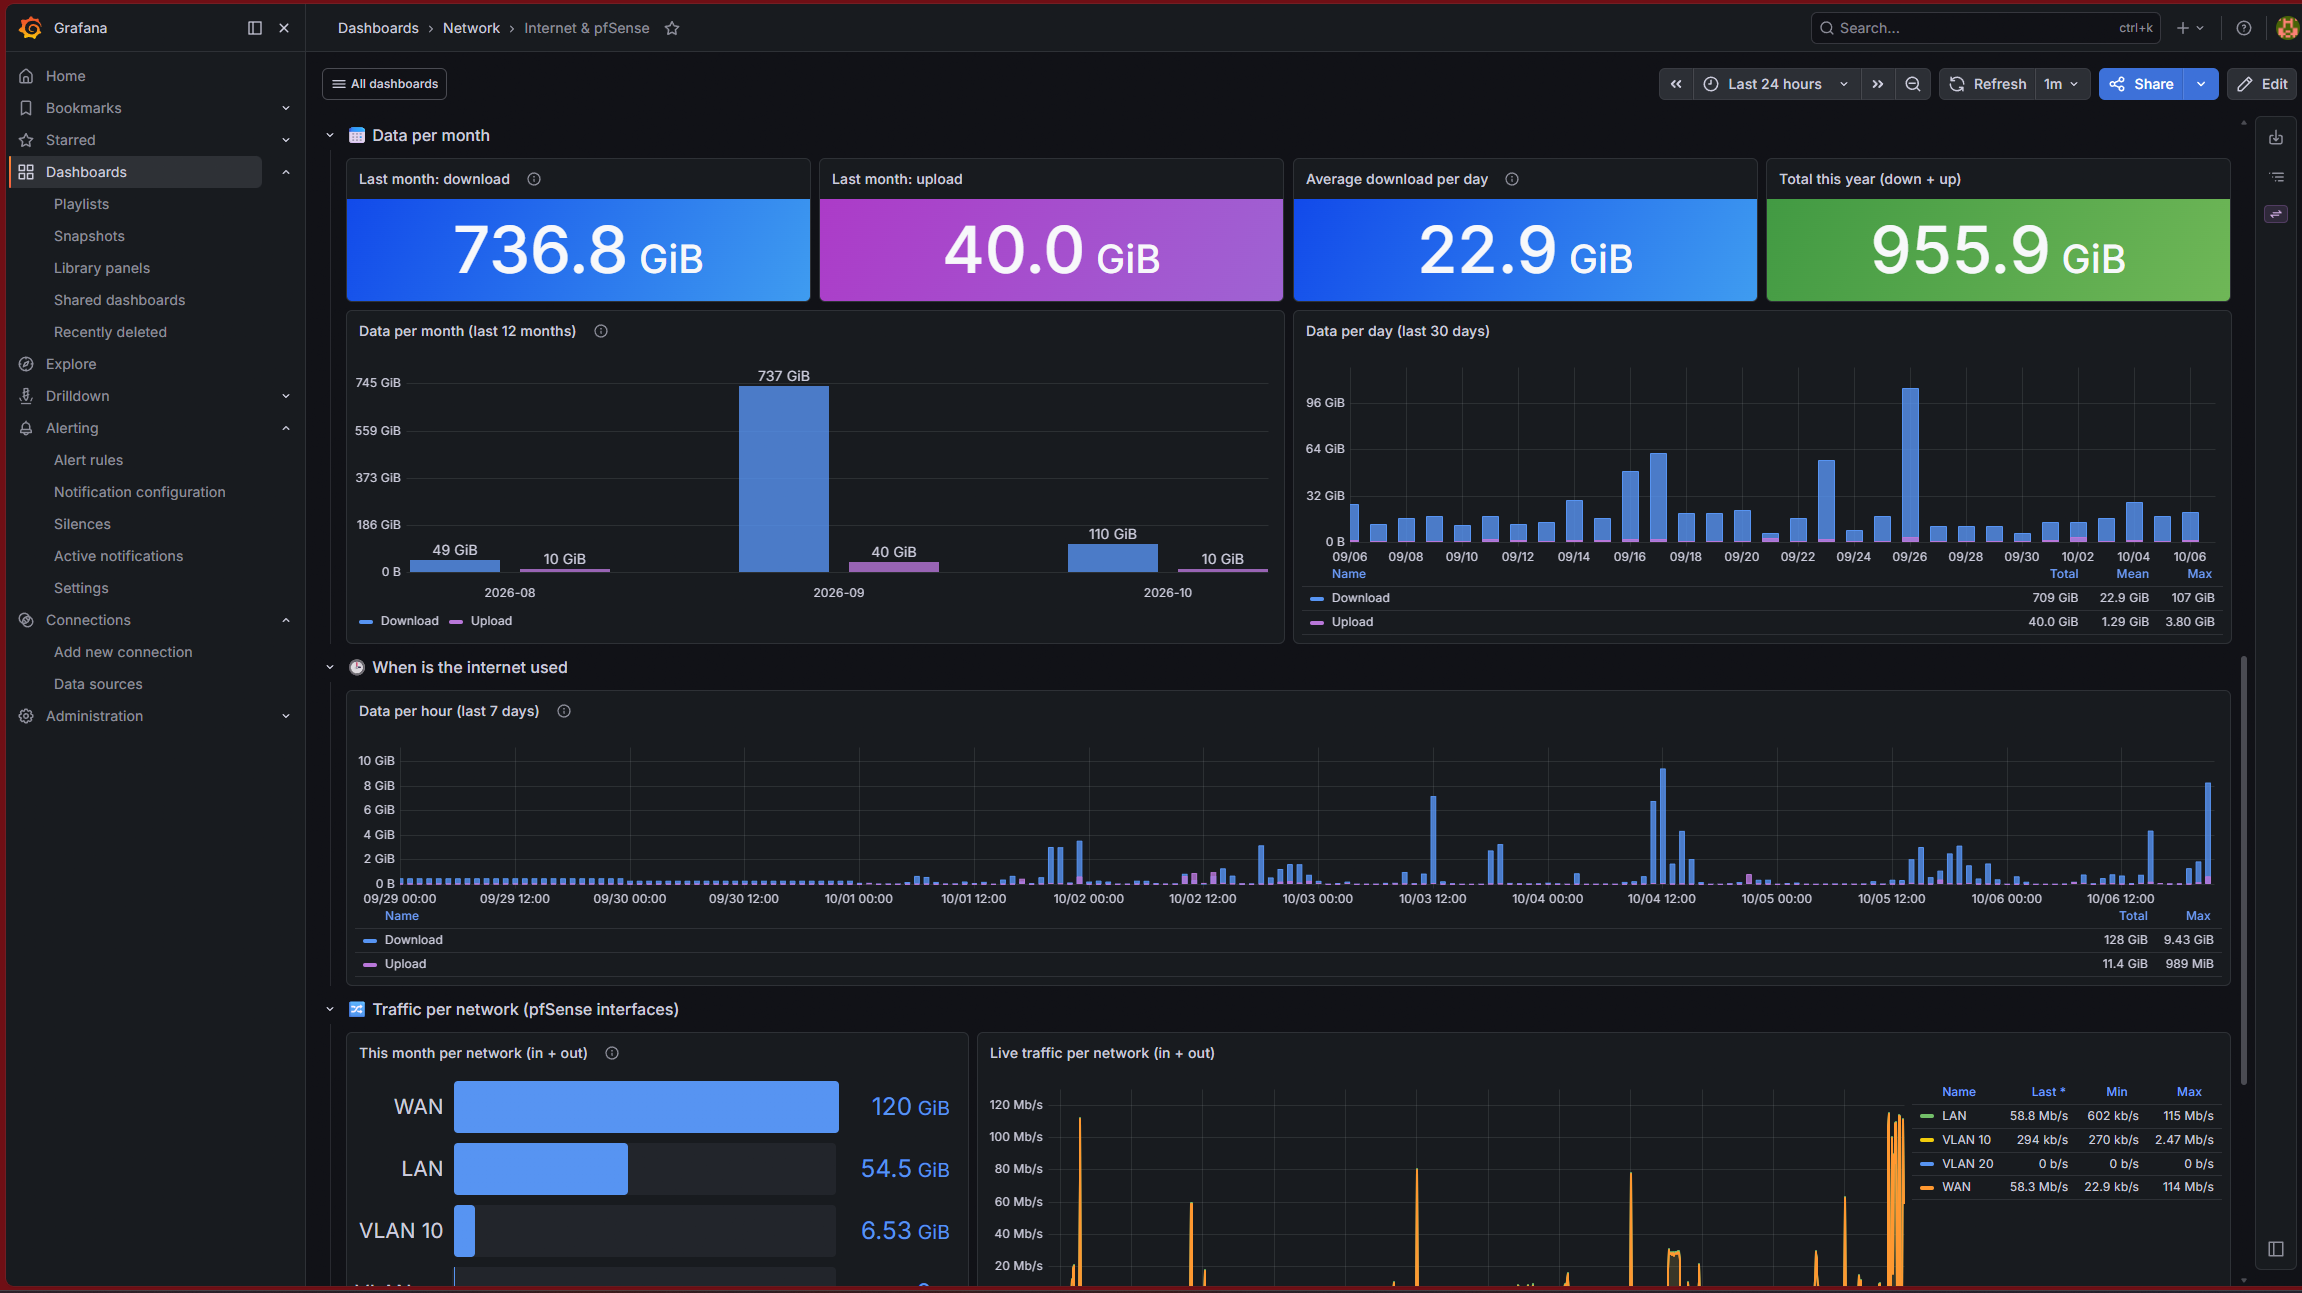
Every device in the house needs your internet line, and pfSense sees all the data that goes through it. In this part Prometheus reads pfSense directly: live WAN traffic, data per day and per month, when the house uses the internet, traffic per network, and pfSense's own health. If you used pfSense's Traffic Totals page before, you can also import its history, so the monthly chart does not start empty.
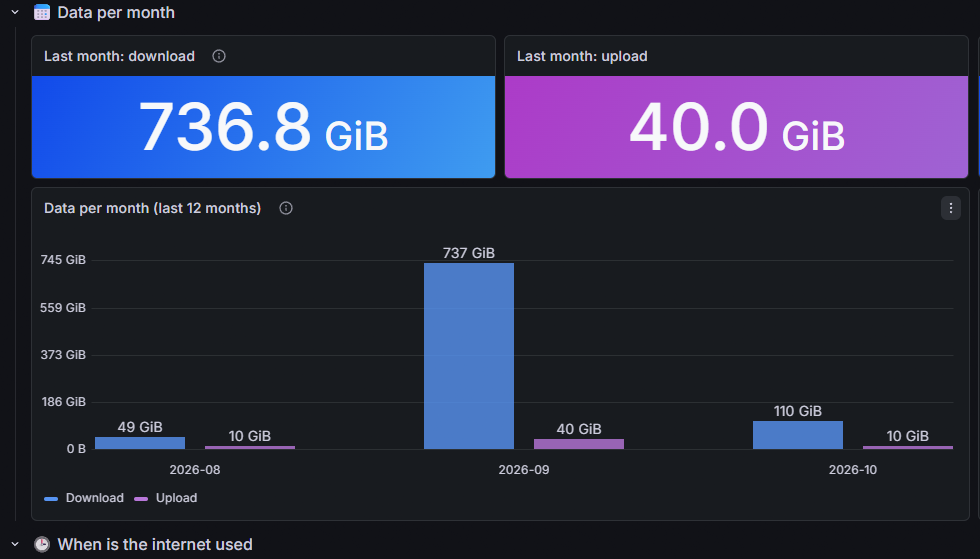
What you get:
| Section | Shows |
|---|---|
| Internet right now | Download and upload speed now, today's and this month's data |
| Data per month | Last month, average per day, this year, a 12-month bar chart, daily bars |
| When is the internet used | Data per hour over the last 7 days |
| Traffic per network | This month's data and live traffic per pfSense interface |
| pfSense health | Online, uptime, CPU, memory, disk, WAN errors |
The dashboard also contains an ISP report card section. It stays empty until Part 7 fills it.
Step 1: Give Prometheus room to grow
Every new data source makes Prometheus store more data. Before you add pfSense, check that the disk of the monitoring container is big enough. In the Proxmox host shell:
pct exec 140 -- df -h /
pct exec 140 -- du -sh /var/lib/docker/volumes/monitoring_prometheus-data
pct exec 140 -- bash -c "curl -s localhost:9090/api/v1/query --data-urlencode 'query=prometheus_tsdb_head_series' | grep -o '\"value\":\[[^]]*\]'"
The last number shows how many time series Prometheus collects. A simple rule: every 10,000 series need about 25–40 MB per day when Prometheus collects every 30 seconds. A homelab with 20,000–25,000 series grows by about 50–100 MB per day. That is 35–75 GB for two years, so the 20 GB disk from Part 1 is too small.
Make the disk bigger. This works while the container is running. It takes a few seconds, and the filesystem grows by itself:
pct resize 140 rootfs 100G
pct exec 140 -- df -h /
You can easily make a Proxmox disk bigger, but you cannot make it smaller again. On LVM-thin storage, the extra space is only used when data is really written.
Add a size limit for safety. When Prometheus reaches the limit, it deletes its oldest data first. Without a limit, it would fill the disk and stop. The command keeps a backup of compose.yaml and restarts only Prometheus:
pct exec 140 -- bash -c "cd /opt/monitoring && mkdir -p backup && cp compose.yaml backup/compose.yaml.\$(date +%Y%m%d-%H%M%S) && (grep -q retention.size compose.yaml || sed -i 's|^\(\s*\)- --storage.tsdb.retention.time=\(.*\)$|&\n\1- --storage.tsdb.retention.size=85GB|' compose.yaml) && grep -n retention compose.yaml && docker compose up -d prometheus"
pct exec 140 -- bash -c "curl -s localhost:9090/api/v1/status/flags | grep -o '\"storage.tsdb.retention.[a-z]*\":\"[^\"]*\"'"
The last line must show both limits, for example:
"storage.tsdb.retention.size":"85GiB"
"storage.tsdb.retention.time":"1y"
Prometheus writes GB as GiB, the same unit that df -h uses. Set the size limit about 15 % below the disk size, so the system, Docker and Grafana still have some space.
The time limit is still the RETENTION you chose in Part 1. To keep data for two years instead of one, change it too:
pct exec 140 -- bash -c "cd /opt/monitoring && sed -i 's|retention.time=.*|retention.time=730d|' compose.yaml && docker compose up -d prometheus"Step 2: Turn on node_exporter in pfSense
pfSense has an official package for the same exporter you already run on Proxmox.
- System → Package Manager → Available Packages, search
node_exporter, click Install → Confirm. - Services → Prometheus node_exporter: tick Enable, set Listen interface to LAN (never WAN), leave the port at 9100, Save.
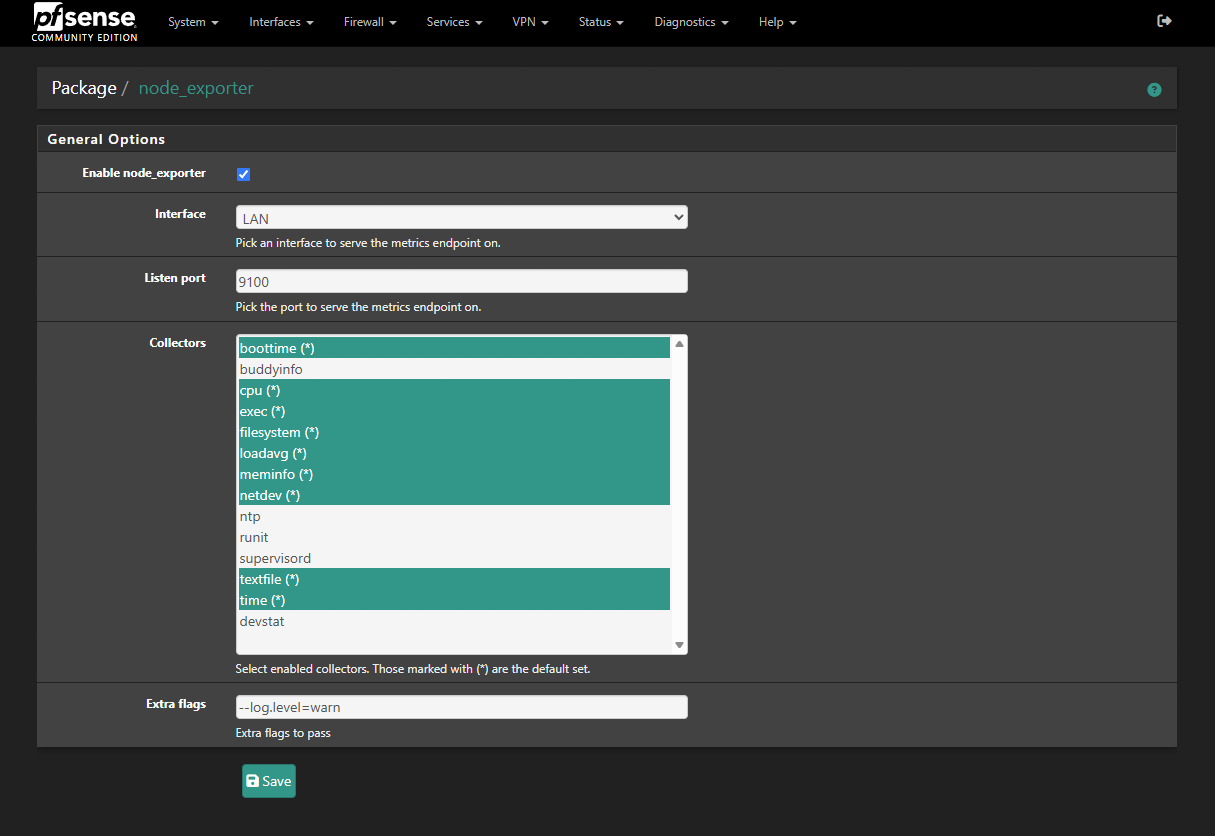
Check the version under Diagnostics → Command Prompt:
/usr/local/bin/node_exporter --version | head -1It should be 1.8.2 or newer. Older pfSense versions came with an exporter that filled the system log with "cannot allocate memory" errors. This is fixed in pfSense Plus 24.11 and newer CE versions.
Step 3: Find your WAN and LAN interface names
Interfaces → Assignments shows the network port behind each interface: igc0, em0, vtnet0 (pfSense as a VM) and so on. Enter the ports behind WAN and LAN under Your values.
Now test from the monitoring container that Prometheus can read pfSense:
pct exec 140 -- bash -c "curl -s --max-time 5 http://192.168.1.1:9100/metrics | grep -E '^node_network_(receive|transmit)_bytes_total\{device=\"(igc0|igc1)\"'"Expected, with your interface names and numbers:
node_network_receive_bytes_total{device="igc0"} 6.2628141307e+10
node_network_receive_bytes_total{device="igc1"} 5.1782822948e+10
node_network_transmit_bytes_total{device="igc0"} 6.301078966e+09
node_network_transmit_bytes_total{device="igc1"} 1.08054886288e+11
Nothing comes back? The default LAN rule "Default allow LAN to any" allows this. If you removed it, add a pass rule on LAN from the monitoring container (192.168.1.40) to This firewall, TCP port 9100.
Step 4: The Prometheus job
The job gives pfSense the name pfsense and names the two network ports WAN and LAN. The dashboard looks for exactly these names.
pct enter 140Inside the container:
P=/opt/monitoring/prometheus/prometheus.yml
cp $P /opt/monitoring/backup/prometheus.yml.$(date +%Y%m%d-%H%M%S)
cat >> $P <<'EOF'

  - job_name: pfsense
    static_configs:
      - targets: ['192.168.1.1:9100']
        labels:
          host: pfsense
    metric_relabel_configs:
      - source_labels: [device]
        regex: igc0
        target_label: iface
        replacement: WAN
      - source_labels: [device]
        regex: igc1
        target_label: iface
        replacement: LAN
EOF
docker exec prometheus promtool check config /etc/prometheus/prometheus.yml && curl -fsS -X POST localhost:9090/-/reload && echo reloaded
The check must end with SUCCESS and then reloaded. To see more networks on the dashboard, for example VLANs, add another block of three lines like the LAN one. Use the VLAN's port name (for example igc1\.10 for VLAN 10) and any name you like.
Step 5: The dashboard
The dashboard colours the speed-test tiles from Part 7 by comparing them with the speed you pay for. This command downloads the dashboard and adds your contract speeds to it:
D=250; U=50
curl -fsSL https://www.zadran.net/downloads/grafana/dashboards/internet-pfsense.json | sed -e "s/777000000/$((D*1000000))/g; s/621600000/$((D*800000))/g; s/388500000/$((D*500000))/g; s/77000000/$((U*1000000))/g; s/61600000/$((U*800000))/g; s/38500000/$((U*500000))/g; s/777 Mbit/$D Mbit/g; s/77 Mbit/$U Mbit/g" > /opt/monitoring/grafana/provisioning/dashboards/files/Network/internet-pfsense.json
grep -c '"title"' /opt/monitoring/grafana/provisioning/dashboards/files/Network/internet-pfsense.json
The last line prints a number around 40. Within a minute the dashboard appears under Network → Internet & pfSense. pfSense now also appears in the Servers tiles of the overview, and the Target down alert from Part 4 watches it automatically.
The numbers use GiB, the same unit pfSense's own pages use, so the two match exactly.
Step 6 (optional): Bring in your pfSense history
If the Traffic Totals package has been running on pfSense, it has your WAN traffic for the last weeks. By default it keeps daily totals for about two months. Prometheus can import this, so the charts start with real history instead of today. Run this step only once, after Step 4: at least ten minutes after the job started, and within 90 days. If you are still inside the container from Step 4, type exit first. Step 6 runs on pfSense and on the Proxmox host.
6a. Export from pfSense. Under Diagnostics → Command Prompt, run:
vnstat --json > /tmp/vnstat.json && ls -la /tmp/vnstat.jsonThen enter /tmp/vnstat.json in the Download File box on the same page and click Download. The file contains only traffic numbers per interface.
6b. Copy it to the Proxmox host. Do this from the computer where you downloaded it. Windows PowerShell already has scp:
scp vnstat.json root@192.168.1.2:/root/6c. Convert and import. In the Proxmox host shell:
cd /root
curl -fsSLO https://www.zadran.net/downloads/grafana/tools/vnstat2prom.py
T0=$(pct exec 140 -- bash -c "curl -fsS -G localhost:9090/api/v1/query --data-urlencode 'query=min_over_time(timestamp(up{job=\"pfsense\"})[90d:5m])'" | grep -o '"value":\[[^]]*\]' | sed -E 's/.*,"([^"]+)"\]/\1/' | cut -d. -f1)
echo "Live pfSense data starts at: $(date -d @$T0)"
python3 vnstat2prom.py vnstat.json wan-history.om --iface igc0 --until $T0
--until stops the history exactly where the live data starts, so nothing is counted twice. Expected:
Live pfSense data starts at: Sun Oct  4 22:15:31 CEST 2026
history 2026-08-30 00:00 -> 2026-10-04 22:15, download 856.76 GiB, upload 56.64 GiB, 206614 samples
Now give the file to Prometheus. It builds storage blocks from it and restarts once to load them. For about 30 seconds it does not collect data:
pct push 140 wan-history.om /tmp/wan-history.om --perms 644
pct exec 140 -- bash -c "docker cp /tmp/wan-history.om prometheus:/tmp/ && rm /tmp/wan-history.om"
pct exec 140 -- docker exec prometheus sh -c 'promtool tsdb create-blocks-from openmetrics -q /tmp/wan-history.om /prometheus/backfill && mv /prometheus/backfill/* /prometheus/ && rmdir /prometheus/backfill'
pct exec 140 -- docker restart prometheus
rm wan-history.om
Import only once. A second import adds the same history again and doubles those months. Prometheus in this setup cannot delete single series, so there is no quick way to undo it. Keep
vnstat.jsonuntil the monthly chart matches pfSense, and do not run Step 6 twice.
Compare with pfSense: Status → Traffic Totals → Monthly and the dashboard's Data per month chart should show the same GiB for every complete month. The oldest imported month is usually incomplete, because pfSense's daily data does not go back to its first day. If you zoom into older weeks, the lines look smoother than today's, because pfSense only kept one total per day for that time.
Troubleshooting
| Problem | Fix |
|---|---|
| Step 3 returns nothing | Firewall: see the note in Step 3. Also check that node_exporter listens on LAN, not on localhost. |
The iface panels are empty, WAN totals work |
The port name in the relabel block doesn't match. Compare with Interfaces → Assignments; VLAN names need the dot escaped (igc1\.10). |
| Monthly numbers are about 7 % higher than pfSense | You are comparing GB with GiB. This dashboard uses GiB like pfSense; another tool may not. |
vnstat2prom.py says interface not in this export |
It lists the names it found. Use the WAN one; it is the same as in Step 3. |
Step 1: retention.size shows 0B |
The container wasn't recreated: pct exec 140 -- bash -c "cd /opt/monitoring && docker compose up -d --force-recreate prometheus" |
In Part 7: a separate check of your internet line, with outages, ping, and regular speed tests compared with the speed you pay for.
Did this guide work for you?
Thank you! That helps me keep this guide right.