Homelab monitoring, Part 7: An ISP report card with outages, ping and speed tests
Record internet outages, ping and speed tests, and get an alert when your internet is down or slow.
Before you start
- The monitoring stack from Parts 1 to 4, and the Internet & pfSense dashboard from Part 6.
- Fill in Your values below and every command on this page updates to match.
Files for this guide
The commands below download these for you. Open one to read it, or import a dashboard by hand.
Dockerfile— Speed test exporter: Dockerfilespeedtest_exporter.py— Speed test exporter: the Python scriptisp.yaml— Grafana alert rules: internet connection
Your values
Fill these in and every command below updates to match. Nothing is sent anywhere.
Run this at your own risk. These steps worked on my hardware; yours may differ. Take a backup first, read each command before running it, and see the disclaimer.
pfSense tells you how much data went through the line. But it does not tell you if the line was down at 3 a.m., if the ping is bad every evening, or if you really get the speed you pay for. This part adds two small containers that answer these questions. They fill the ISP report card section of the dashboard from Part 6:
| Tile | Shows |
|---|---|
| Internet / Availability / Outages / Downtime | Up or down right now, and this month's availability in %, number of outages and total minutes offline |
| Ping now / Packet loss | Latency to the internet and lost packets over the last 24 hours |
| Last test: download / upload / ping | The latest speed test, coloured against your contract |
| Average / Slowest download this month | What you really got, over the month |
| Speed tests (last 30 days) | Every test as a step, with your contract speeds as dashed lines |
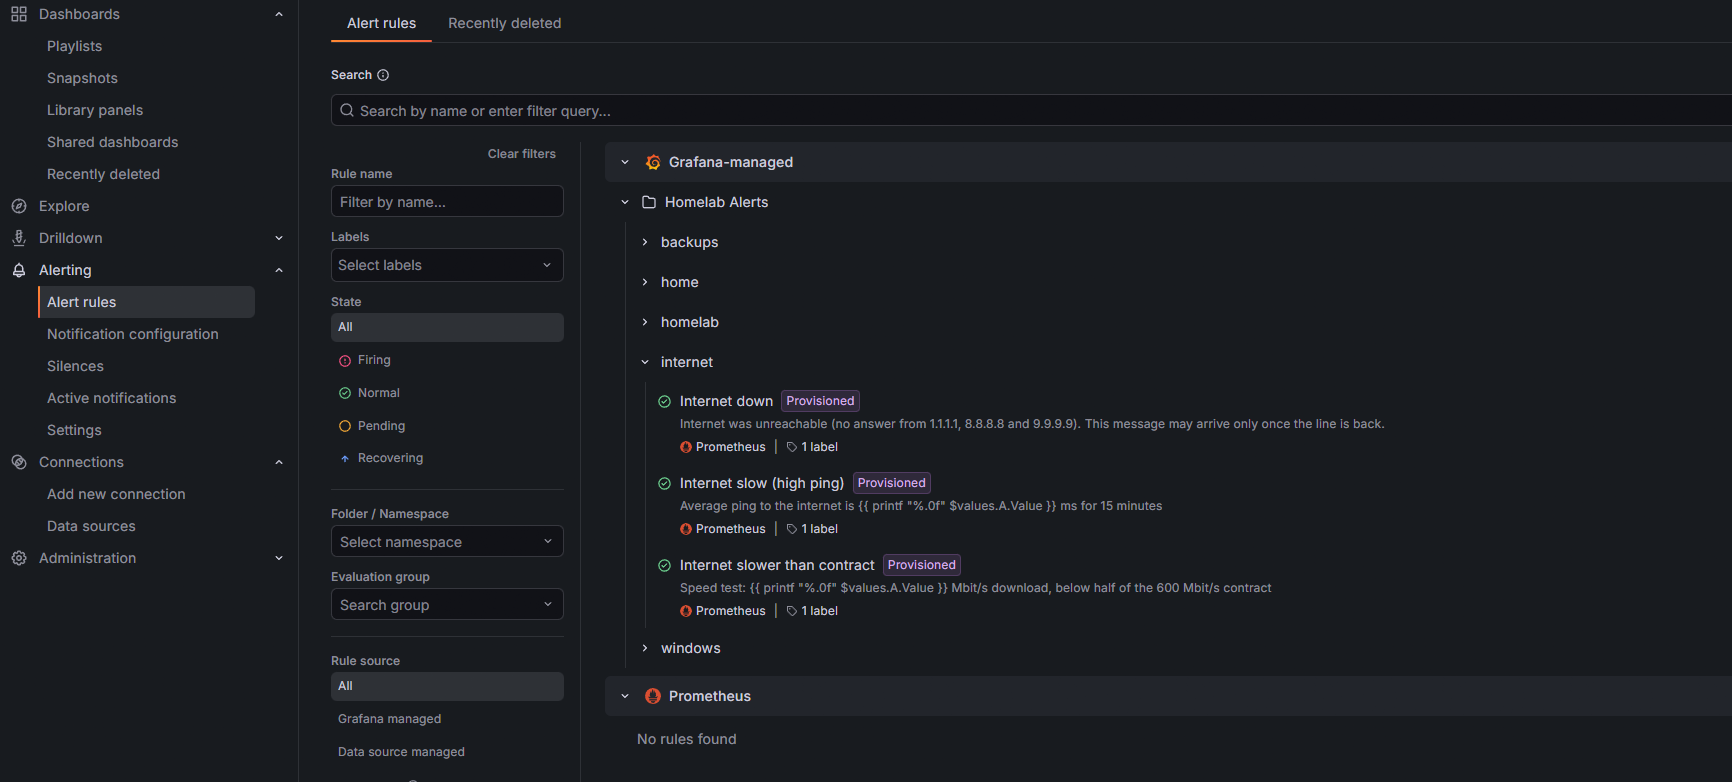
Two alerts come with it: Internet down and Internet slower than contract, sent to your phone like the alerts from Part 4.
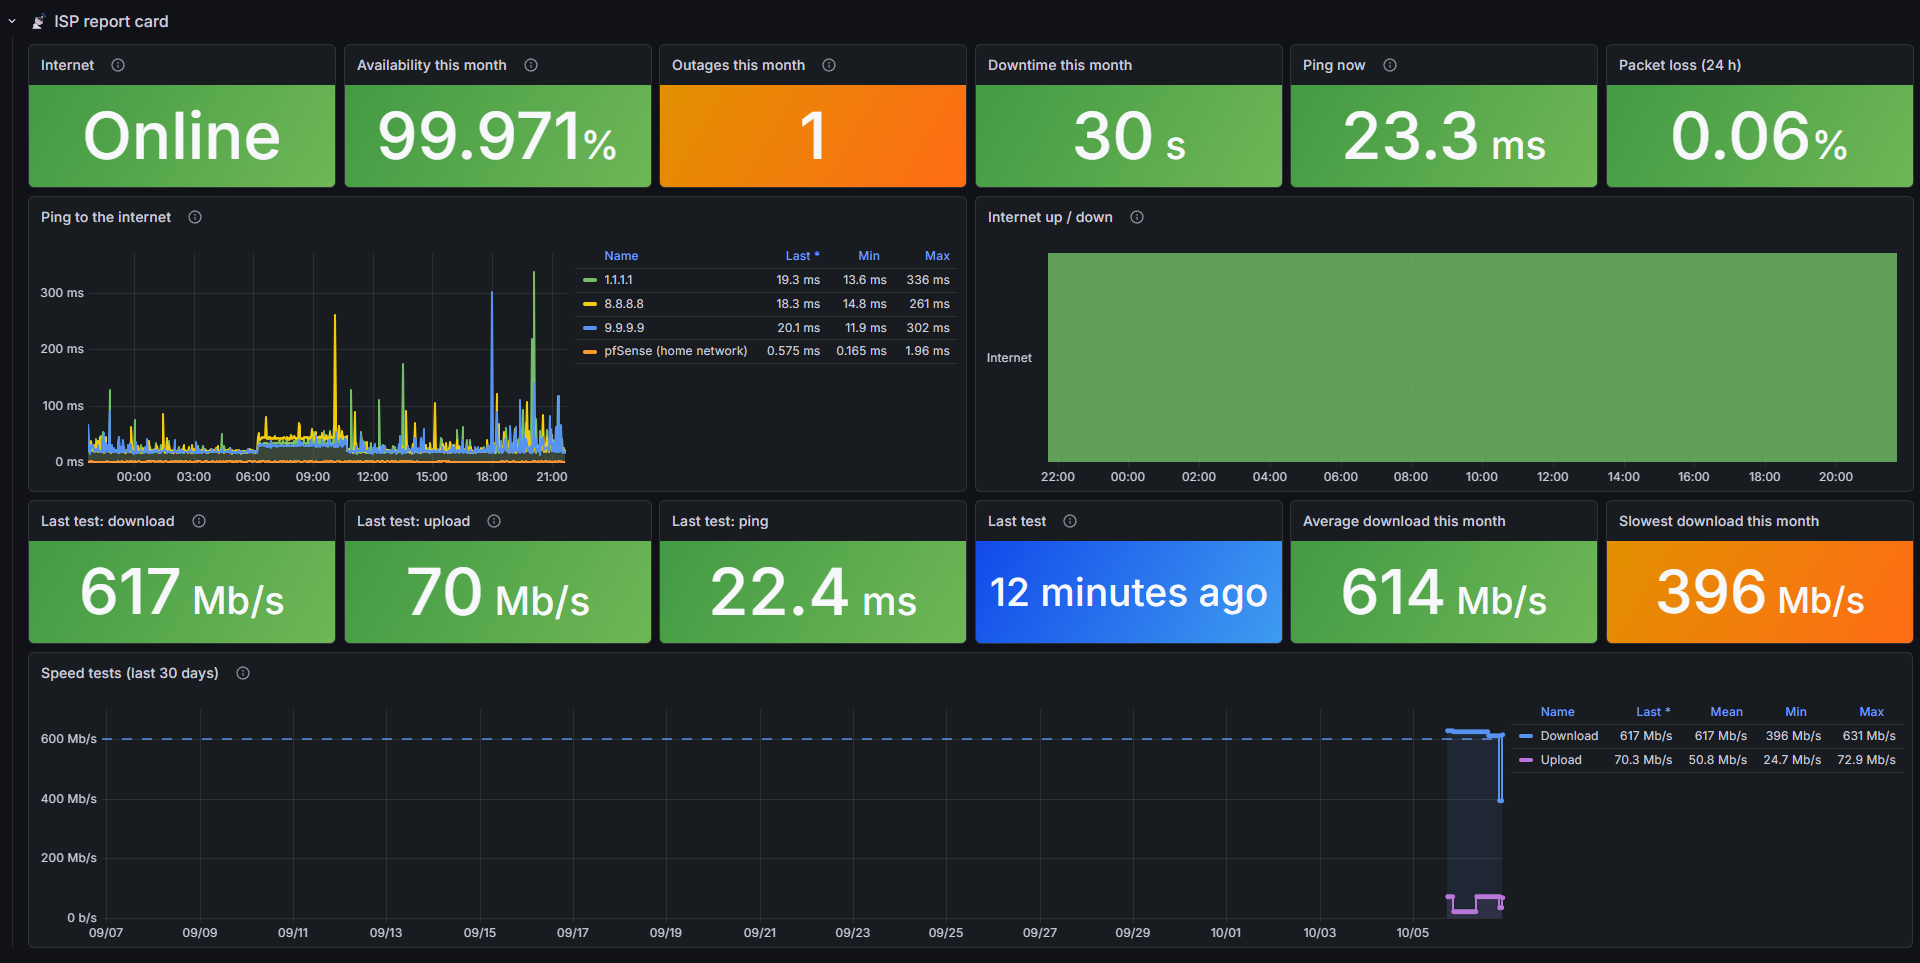
How it works:
- blackbox_exporter pings Cloudflare (1.1.1.1), Google (8.8.8.8) and Quad9 (9.9.9.9) every 30 seconds, and pfSense too. The internet only counts as down when all three fail. If one provider has a bad minute, that is not a problem with your line.
- A speed-test exporter runs the official Ookla Speedtest CLI at fixed hours of the day and keeps the last result. Prometheus only reads the saved result, so it never starts a test itself.
Data use. A speed test downloads and uploads for about 10 seconds each, at full speed. On a 250 Mbit/s line that is about 400 MB per test. Three tests a day use about 35 GB a month. On an unlimited line that does not matter. If your data is limited, choose fewer hours in Your values. The tests also appear as short spikes in the WAN graphs of Part 6. This is a good way to check that both agree.
Step 1: The files for the two containers
From the Proxmox host shell, go into the monitoring container:
pct enter 140Inside the container, create the ping settings and download the speed-test exporter. The exporter is a short Python script. If you want to read it first, open it in the browser.
cd /opt/monitoring
mkdir -p blackbox speedtest

cat > blackbox/blackbox.yml <<'EOF'
modules:
  icmp:
    prober: icmp
    timeout: 5s
    icmp:
      preferred_ip_protocol: ip4
      ip_protocol_fallback: false
EOF

curl -fsSL -o speedtest/Dockerfile https://www.zadran.net/downloads/grafana/speedtest/Dockerfile
curl -fsSL -o speedtest/speedtest_exporter.py https://www.zadran.net/downloads/grafana/speedtest/speedtest_exporter.py
ls -l blackbox speedtest
ls must list three files, none of them 0 bytes.
| File | What it does |
|---|---|
blackbox.yml |
One "module" called icmp: an IPv4 ping with a 5-second timeout |
Dockerfile |
A small Python image with the Ookla Speedtest CLI |
speedtest_exporter.py |
Runs a test at the listed hours and serves the result on port 9798 |
Step 2: Add the containers
The two services go into compose.override.yaml from Part 2, below the existing ones. The first line only creates the file if you skipped Part 2.
cd /opt/monitoring
mkdir -p backup
cp compose.override.yaml backup/compose.override.yaml.$(date +%Y%m%d-%H%M%S) 2>/dev/null
[ -f compose.override.yaml ] || echo "services:" > compose.override.yaml
cat >> compose.override.yaml <<'EOF'

  blackbox:
    image: prom/blackbox-exporter:latest
    container_name: blackbox
    restart: unless-stopped
    user: root
    cap_add:
      - NET_RAW
    command:
      - --config.file=/etc/blackbox/blackbox.yml
    volumes:
      - ./blackbox/blackbox.yml:/etc/blackbox/blackbox.yml:ro

  speedtest:
    build: ./speedtest
    image: local/speedtest-exporter
    container_name: speedtest
    restart: unless-stopped
    environment:
      - TZ=Europe/Berlin
      - SPEEDTEST_HOURS=8,14,20
EOF
docker compose config -q && docker compose up -d --build blackbox speedtest
Building the speed-test image takes about a minute. docker compose config -q prints nothing when the file is correct. If it shows an error, the spaces at the start of the pasted lines are wrong. There must be two spaces before blackbox: and speedtest:.
| Setting | Why |
|---|---|
user: root and cap_add: NET_RAW |
Sending a ping needs a raw network socket. Without both, every ping fails with operation not permitted. |
SPEEDTEST_HOURS |
The hours (local time, from TZ) at which a test runs. 8,14,20 gives morning, afternoon and evening. Plus one test each time the container starts. |
No ports: |
Only Prometheus talks to these two, over Docker's internal network. Nothing is opened to your LAN. |
Step 3: The Prometheus jobs
P=/opt/monitoring/prometheus/prometheus.yml
cp $P /opt/monitoring/backup/prometheus.yml.$(date +%Y%m%d-%H%M%S)
cat >> $P <<'EOF'

  - job_name: isp-ping
    metrics_path: /probe
    params:
      module: [icmp]
    static_configs:
      - targets: ['1.1.1.1', '8.8.8.8', '9.9.9.9']
        labels:
          probe: internet
      - targets: ['192.168.1.1']
        labels:
          probe: pfsense
    relabel_configs:
      - source_labels: [__address__]
        target_label: __param_target
      - source_labels: [__param_target]
        target_label: instance
      - target_label: __address__
        replacement: blackbox:9115

  - job_name: speedtest
    scrape_interval: 60s
    static_configs:
      - targets: ['speedtest:9798']
        labels:
          host: speedtest
EOF
docker exec prometheus promtool check config /etc/prometheus/prometheus.yml && curl -fsS -X POST localhost:9090/-/reload && echo reloaded
The relabel_configs turn each address in the list into a request to blackbox: "ping 1.1.1.1 for me". The ping to pfSense is for comparison. If the internet is down but pfSense still answers, the problem is outside your house.
Wait one minute, then check both:
curl -s -G localhost:9090/api/v1/query --data-urlencode 'query=probe_success{job="isp-ping"}' | grep -o '"instance":"[^"]*"\|"value":\[[^]]*\]' | paste - -
docker logs speedtest 2>&1 | tail -2
Expected: four targets ending in "1", and a test line with your speeds.
"instance":"1.1.1.1"	"value":[1791302400.123,"1"]
"instance":"8.8.8.8"	"value":[1791302400.123,"1"]
"instance":"9.9.9.9"	"value":[1791302400.123,"1"]
"instance":"192.168.1.1"	"value":[1791302400.123,"1"]
speedtest exporter on :9798, tests at 8,14,20:00 (Europe/Berlin)
2026-10-06 15:42:11 ok: 243 / 48 Mbit/s, ping 11.2 ms, server Example ISP - Frankfurt
If the second line is missing, the first test is still running. Wait half a minute and run docker logs speedtest again.
Step 4: The alerts
The alert file uses the contact point and notification policy from Part 4. This command downloads it and writes your contract speed into it:
D=250
curl -fsSL https://www.zadran.net/downloads/grafana/alerting/isp.yaml | sed -e "s/777 Mbit/$D Mbit/g; s/388\.5\]/$((D/2))]/g" > /opt/monitoring/grafana/provisioning/alerting/isp.yaml
grep -n 'Mbit\|params: \[' /opt/monitoring/grafana/provisioning/alerting/isp.yaml
cd /opt/monitoring && docker compose restart grafana
grep shows your contract in the message and half of it as the threshold.
| Alert | Fires when | Notes |
|---|---|---|
| Internet down | No answer from all three providers for 2 minutes | Your phone gets it over the internet, so it often arrives after the line is back. It still tells you when and how long. |
| Internet slow (high ping) | Average ping above 100 ms for 15 minutes | Usually the provider's network is busy in the evening |
| Internet slower than contract | A speed test measures less than half your contract download | One slow test can be your own big download at the same time. If it happens for days, call your provider. |
Step 5: Read the report card
Open Network → Internet & pfSense. The ISP report card row now fills. The first speed test appears right away. Availability and outages build up over the month.
- Availability this month counts from the 1st, or from the day you started. 99.9 % is about 43 minutes offline in a month.
- Outages are counted one by one, so ten short drops of one minute show as 10, not as one long break.
- In Speed tests (last 30 days) each step is one test. If the speed is low only in the evening, the provider's network is busy. If it is low all the time, the problem is the line or the modem.
Speeds above about 900 Mbit/s? The test runs inside the monitoring container, so it cannot be faster than the network port of the Proxmox host. On a 1 Gbit port, a 1 Gbit contract measures about 900–940 Mbit/s.
Troubleshooting
| Problem | Fix |
|---|---|
All four pings 0, blackbox log says operation not permitted |
user: root or cap_add: NET_RAW missing in Step 2. Fix it and run docker compose up -d blackbox. |
Internet pings 0, pfSense ping 1 |
Real outage, or pfSense blocks outgoing ICMP from this container. Test: docker exec blackbox ping -c 2 1.1.1.1 |
FAILED: ... timed out after 120 seconds in the speedtest log |
The test took longer than 120 s. Add - SPEEDTEST_TIMEOUT=240 under environment: and run docker compose up -d speedtest. |
FAILED: ... returned non-zero exit status |
The Ookla CLI itself failed, often because its server list was busy. One failure is normal and the next test usually works. If every test fails, run one by hand to see the real message: docker exec speedtest speedtest --accept-license --accept-gdpr |
Speed tile empty, log shows ok |
Prometheus job missing or not reloaded. In Prometheus, Status → Target health must show speedtest as UP. |
| Tests at the wrong hours | TZ is wrong. Fix TIMEZONE in Step 2 and recreate: docker compose up -d speedtest. |
| You want a fixed test server | Find its ID with docker exec speedtest speedtest -L --accept-license, then add - SPEEDTEST_SERVER=<ID> under environment: |
The Ookla CLI is free for personal, non-commercial use. The image accepts its licence for you when it runs.
In Part 8: backups. A dashboard and an alert tell you when a VM has no recent backup, before you need it.
Did this guide work for you?
Thank you! That helps me keep this guide right.