Homelab monitoring, Part 3: Ready-made dashboards, sorted into folders
Ready-made Grafana dashboards for Proxmox, your NAS and UniFi, loaded from files, with fixes for panels that show wrong values.
Before you start
- The monitoring stack from Part 1 and the data sources from Part 2.
- Fill in Your values below and every command on this page updates to match.
Files for this guide
The commands below download these for you. Open one to read it, or import a dashboard by hand.
nas-pools.json— Grafana dashboard: NAS pools and health
Your values
Fill these in and every command below updates to match. Nothing is sent anywhere.
Run this at your own risk. These steps worked on my hardware; yours may differ. Take a backup first, read each command before running it, and see the disclaimer.
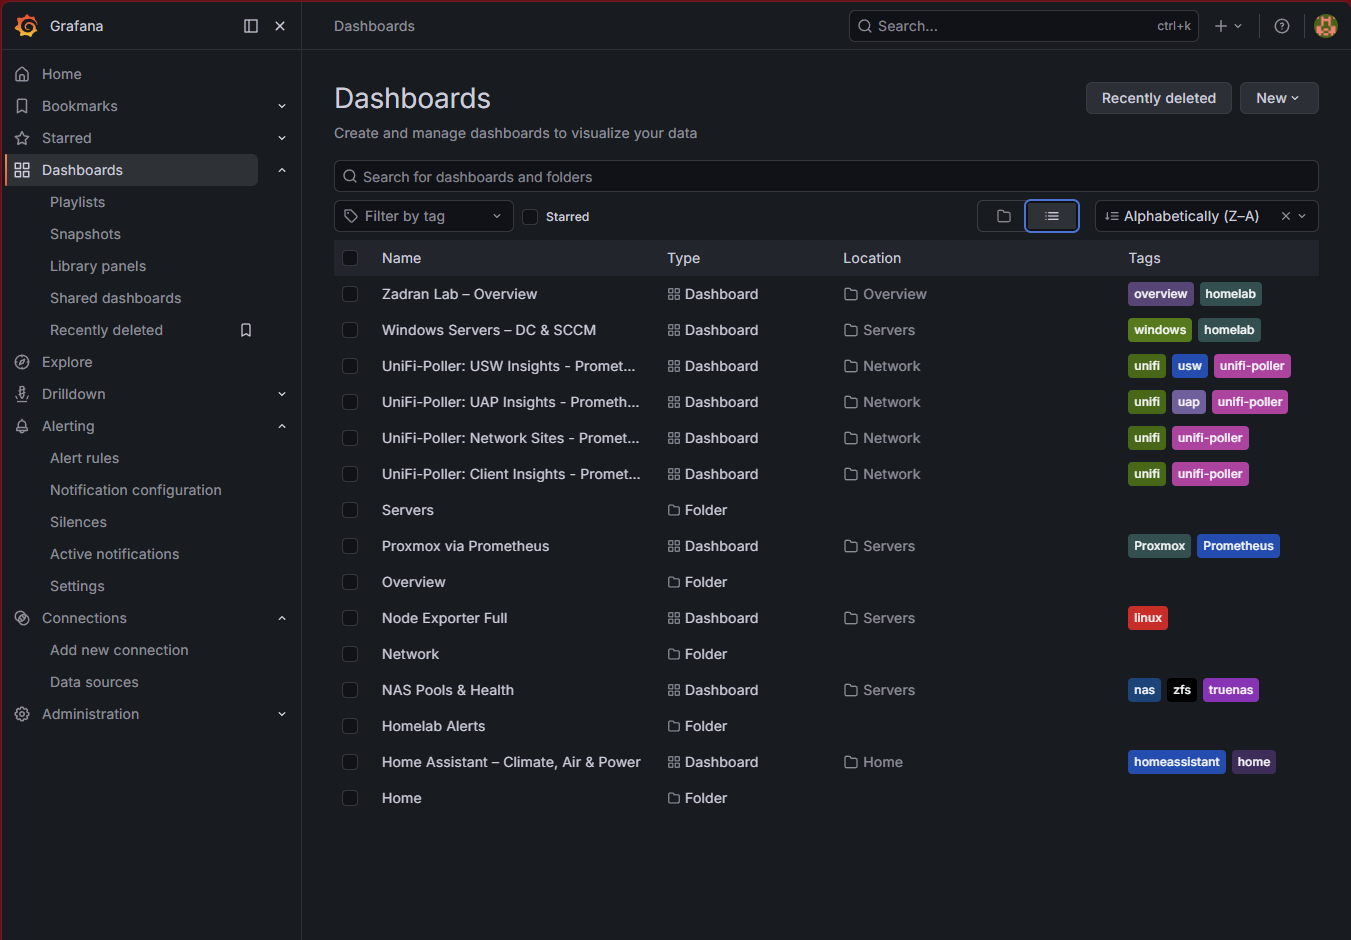
Your data is now arriving (Parts 1 and 2). Now you make it visible. Instead of building dashboards by clicking in the browser, you save them as files in folders. Grafana loads them automatically. The big advantage: if the container ever breaks, the dashboards come back exactly as they were.
| Folder | Dashboard | Source |
|---|---|---|
| Servers | Node Exporter Full | grafana.com, ID 1860 |
| Servers | Proxmox via Prometheus | grafana.com, ID 10347, with a CPU fix |
| Servers | NAS Pools & Health | download from this site |
| Network | 4 × UniFi-Poller | GitHub, with fixes |
Everything below runs in the monitoring container (pct enter 140 from the Proxmox host shell).
Step 1: Tell Grafana where the dashboards live
mkdir -p /opt/monitoring/grafana/provisioning/dashboards/files/{Servers,Network}

cat > /opt/monitoring/grafana/provisioning/dashboards/dashboards.yaml <<'EOF'
apiVersion: 1
providers:
  - name: homelab
    orgId: 1
    type: file
    disableDeletion: true
    allowUiUpdates: false
    updateIntervalSeconds: 60
    options:
      path: /etc/grafana/provisioning/dashboards/files
      foldersFromFilesStructure: true
EOF| Setting | Meaning |
|---|---|
foldersFromFilesStructure |
Each subfolder (Servers, Network…) becomes a Grafana folder |
allowUiUpdates: false |
The files are the master copy. Changes in the browser can't be saved by accident (see "Changing a dashboard" below). |
updateIntervalSeconds: 60 |
A changed file shows up in Grafana within a minute |
Step 2: A small helper
Dashboards from grafana.com contain a placeholder (${DS_PROMETHEUS}) that the browser import normally fills in. This helper does the same in a file. Paste it once per shell session:
fix_ds() {
  jq 'walk(if type == "string" then gsub("\\$\\{DS_PROMETHEUS\\}"; "prometheus") else . end)
      | del(.__inputs, .__requires, .__elements) | .id = null' "$1"
}
cd /tmp
Step 3: Node Exporter Full
The best-known dashboard for Linux servers: CPU, RAM, disks, network, temperatures, all in detail.
curl -fsSL -o 1860.json https://grafana.com/api/dashboards/1860/revisions/latest/download
fix_ds 1860.json > /opt/monitoring/grafana/provisioning/dashboards/files/Servers/node-exporter-full.json
Step 4: Proxmox via Prometheus, with the CPU fix
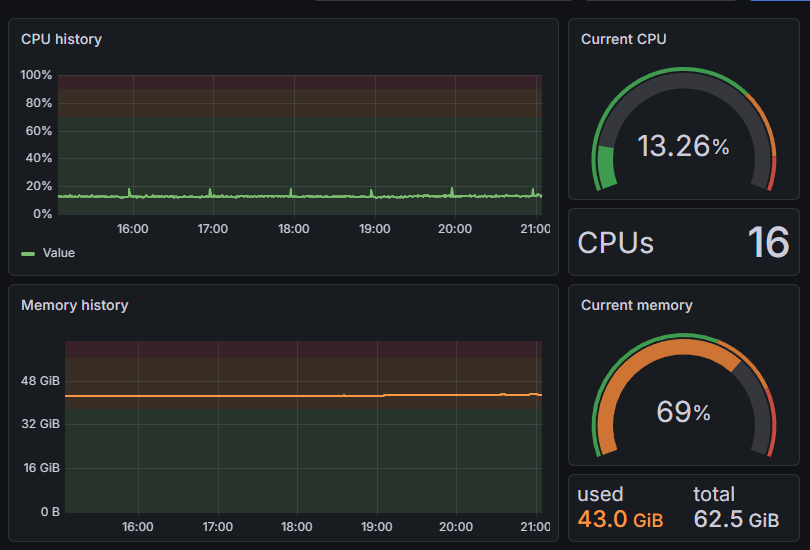
This dashboard shows every VM and container. But out of the box, its CPU gauges for the host are wrong. Depending on the version, they show only part of the real load, or impossible values like 793 %. The fix takes the host CPU from node_exporter (Part 1) instead, which is correct.
curl -fsSL -o 10347.json https://grafana.com/api/dashboards/10347/revisions/4/download
CPU='100 - avg(rate(node_cpu_seconds_total{mode="idle", instance=~"$instance:.*"}[1m])) * 100'
fix_ds 10347.json | jq --arg cpu "$CPU" '
    (.. | objects | select(.id? == 7 and has("targets"))) |=
        (.targets |= [.[0] | .expr = $cpu]
         | .fieldConfig.defaults.unit = "percent" | .fieldConfig.defaults.max = 100
         | .fieldConfig.defaults.thresholds.steps[1].value = 70
         | .fieldConfig.defaults.thresholds.steps[2].value = 90)
  | (.. | objects | select(.id? == 23 and has("targets"))) |=
        (.targets |= [.[0] | .expr = $cpu]
         | .fieldConfig.defaults.unit = "percent" | .fieldConfig.defaults.min = 0 | .fieldConfig.defaults.max = 100)
  | (.. | objects | select(.id? == 22 and has("targets"))) |=
        (.targets[0].expr = "count(count by (cpu) (node_cpu_seconds_total{instance=~\"$instance:.*\"}))")
' > /opt/monitoring/grafana/provisioning/dashboards/files/Servers/proxmox.json
grep -c node_cpu_seconds_total /opt/monitoring/grafana/provisioning/dashboards/files/Servers/proxmox.json
The last line must print 3 or more: the three panels Current CPU, CPU history and the CPU count are patched.
/revisions/4/fixes the dashboard to the exact version this fix was written for. A newer version could number its panels differently, and the fix would no longer fit.
Step 5: NAS Pools & Health
A dashboard for the pool metrics from Part 2: usage, free space, health, and a "days until 80 % full" estimate.
curl -fsSL -o /opt/monitoring/grafana/provisioning/dashboards/files/Servers/nas-pools.json \
  https://www.zadran.net/downloads/grafana/dashboards/nas-pools.json
The growth estimate needs a few days of data before it shows a sensible value.
Step 6: UniFi-Poller (4 dashboards)
The official Unpoller dashboards, in a version I have tested. In the UAP (access point) dashboard, five panels need a fix:
| Panel | Problem in the original | Fix |
|---|---|---|
| Users, Guests | Count stays at 0 with current UniFi versions | Count real Wi-Fi clients; guests = clients on an SSID with "guest" in its name |
| Three pie charts | Empty with longer time ranges | Show the current value |
| Clock | Needs a plugin we don't install | Removed |
D=/opt/monitoring/grafana/provisioning/dashboards/files/Network
RAW=https://raw.githubusercontent.com/unpoller/dashboards/adbe342f09d0fe06b1cc152d28ab0bae5ee3d8b9/v2.0.0
for pair in "Client%20Insights:unifi-clients" "Network%20Sites:unifi-sites" "UAP%20Insights:unifi-uap" "USW%20Insights:unifi-usw"; do
  curl -fsSL -o "/tmp/${pair#*:}.json" "$RAW/UniFi-Poller_%20${pair%%:*}%20-%20Prometheus.json"
  fix_ds "/tmp/${pair#*:}.json" > "$D/${pair#*:}.json"
done
jq '
    walk(if type == "object" and has("panels") then .panels |= map(select(.id != 32)) else . end)
  | (.. | objects | select(.id? == 48 and has("targets"))) |=
        (.targets[0].expr = "count(unpoller_client_uptime_seconds{site_name=~\"$Site\", ap_name=~\"$AP\", wired=\"false\"}) or vector(0)")
  | (.. | objects | select(.id? == 60 and has("targets"))) |=
        (.targets[0].expr = "count(unpoller_client_uptime_seconds{site_name=~\"$Site\", ap_name=~\"$AP\", wired=\"false\", essid=~\"(?i).*guest.*\"}) or vector(0)")
  | (.. | objects | select((.id? == 52 or .id? == 54 or .id? == 56) and has("targets"))) |=
        (.targets |= map(.instant = true | .range = false))
' "$D/unifi-uap.json" > /tmp/uap.json && mv /tmp/uap.json "$D/unifi-uap.json"
ls -1 $D
The last line lists the four files.
Step 7: Load them
cd /opt/monitoring && docker compose restart grafana
sleep 20
set -a; . /opt/monitoring/.env; set +a
curl -s -u "admin:$GRAFANA_ADMIN_PASSWORD" 'localhost:3000/api/search?type=dash-db' |
  jq -r '.[] | "\(.folderTitle)\t\(.title)"' | sort | column -t -s $'\t'
Expected:
Network  UniFi-Poller: Client Insights - Prometheus
Network  UniFi-Poller: Network Sites - Prometheus
Network  UniFi-Poller: UAP Insights - Prometheus
Network  UniFi-Poller: USW Insights - Prometheus
Servers  NAS Pools & Health
Servers  Node Exporter Full
Servers  Proxmox via Prometheus
Open Proxmox via Prometheus in Grafana. Current CPU should match the CPU value on the Proxmox web UI's summary page.
Changing a dashboard
Because the files are the master copy, the Save button shows "Cannot save provisioned dashboard". This is on purpose. To change something:
- Make the change in the browser.
- Click Export → Export as JSON → Copy to clipboard.
- Open the matching file, e.g.
nano /opt/monitoring/grafana/provisioning/dashboards/files/Servers/proxmox.json, replace its content, and save. - Within 60 seconds Grafana shows the new version.
To get rid of a dashboard, delete its file.
Troubleshooting
| Problem | Fix |
|---|---|
| A dashboard shows "Datasource ${DS_PROMETHEUS} was not found" | The file was copied without fix_ds. Repeat its step. |
| Proxmox: Current CPU empty | node_exporter isn't running on the host (Part 1, Step 5), or the Proxmox host is selected under a different IP than node_exporter uses. |
| UniFi dashboards empty | Check that the unpoller target is UP (Part 2), then pick your site in the Site drop-down at the top. |
| A folder doesn't appear | It's empty. Grafana only shows folders that contain at least one dashboard file. |
In Part 4, Grafana starts sending alerts to your phone.
Did this guide work for you?
Thank you! That helps me keep this guide right.